The first wave becomes visible.
Demand hits a thin commodity supply base. Geopolitical shocks intensify the move, but the underlying problem is physical scarcity.

Rate hikes can bring an inflationary fever down, temporarily. The Fed cannot drill a well, open a mine, or build a refinery.
In Recurrent's 1960–2022 sample, recessions and Fed tightening predicted lower inflation about as well as a coin flip. High commodity capex was the cure that lasted.
Markets treated the dip in inflation as proof the shortage was over. The dip itself helped keep capex from arriving. That is how a pause becomes a second wave.
Inflation appears when ordinary growth runs through a commodity supply base that never caught up. The economy can look fine while it is eating the last cycle's spare inventory. Then the cushion is gone.
Source: Recurrent, The Great Inflation Misdiagnosis (2022). The percentages shown use the 1960–2022 sample. “High commodity capex” means the top 25% of inflation-adjusted commodity investment, as measured by the U.S. Bureau of Economic Analysis; the outcome is below-average inflation one year later. Recession and Fed-tightening observations use the definitions in the original research. These are historical conditional frequencies, not causal estimates.
A multi-year surge in real commodity capex followed by persistently high inflation would cut against the framework. So would a late-1970s-scale buildout in the 2020s followed by continued shortage behavior across the long-cycle commodity complex.
The dangerous moment is not the spike. It is the remission. The mid-1970s pause lowered headline inflation before the supply response arrived. That is the part of the cycle that rhymes with 2023–25.
The first wave was a commodity shock intensified by geopolitics and met with Nixon-era price controls. Inflation cooled when demand did. Capex did not take the handoff.
The second wave is the one popular memory compresses into “Volcker.” By then the investment backdrop had changed. Oil-price decontrol improved the economics of new drilling, real commodity capex accelerated, and new supply began to change the ending.
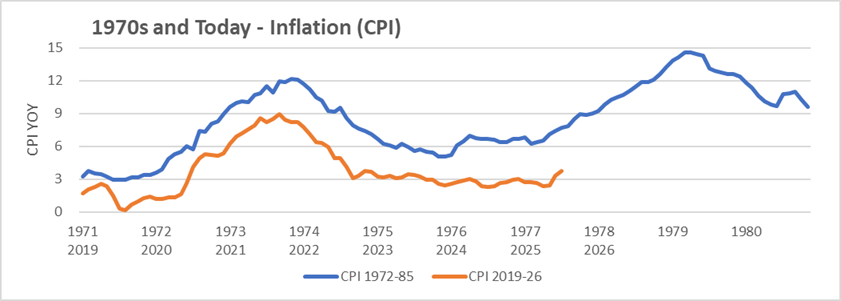
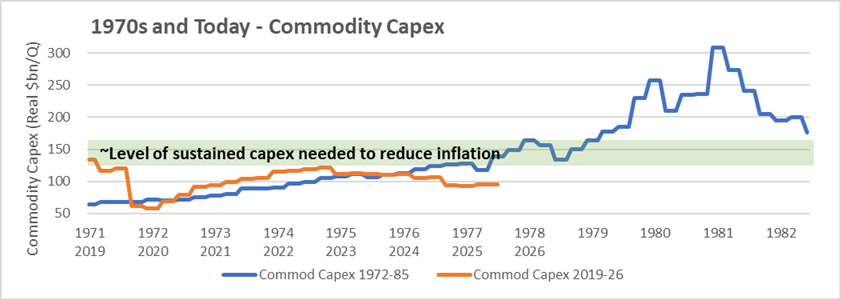
Source: Recurrent research; U.S. Bureau of Labor Statistics; U.S. Bureau of Economic Analysis; St. Louis Fed/FRED. The figures compare the historical 1970s path with the 2019–26 period.
Demand hits a thin commodity supply base. Geopolitical shocks intensify the move, but the underlying problem is physical scarcity.
Recession and tighter policy bring the fever down. The urgency leaves with the headline numbers, and the supply response remains too small.
The economy does not need to boom. Demand only has to recover faster than the commodity supply base can respond.
Carter's move toward decontrol improved the expected return on new drilling. Real commodity capex accelerated before Volcker got the credit in the popular story. That is the step the 2020s have not taken.
Volcker can suppress demand. The expanding supply base helps make lower inflation compatible with recovery. The broader economy inherits room to grow; commodity producers inherit the bust.
A company can be printing cash and still refuse to grow. If the market values existing assets below replacement cost, a new project can destroy market value even when its operating economics look attractive.
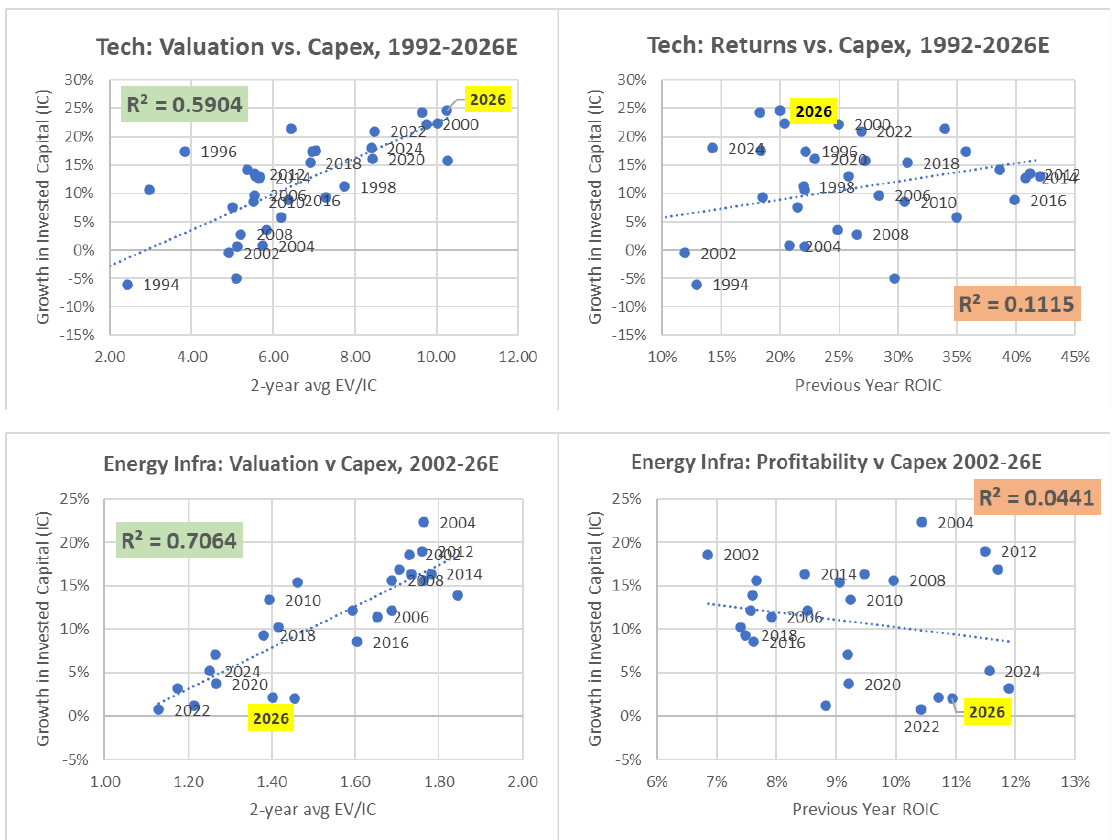
High prices and high profits do not consistently pull capex through. The market can finance a technology story at 5× invested capital and tell a profitable miner to shrink. That was load-bearing in the ESG-divestment years. It is still load-bearing now.
Price caps, SPR drains, a surge in Venezuelan barrels, small-refinery exemptions (SREs), and gasoline blending waivers can take the spike out of the chart. They are borrowed barrels and bent rules. They do not add productive capacity.
For a project that spends years 1–5 earning nothing, those interventions are not noise. They are a reason to wait.
2023–2025 wasn't a repeat of 1975–77, but to paraphrase Mark Twain, it sure did rhyme. Inflation fell just enough to convince markets the problem was over. Commodity capex slowed, leaving the system more vulnerable when geopolitical shocks tightened supply. In both decades, weak mid-cycle capex left the economy entering the next shock with less room for error.
In 1978–79, storage made a shortage look manageable until the tanks were empty. In 2025–26, the same trick is easier in short-cycle oil than in long-cycle infrastructure.
The shock begins, but inventories and spare capacity initially cushion the visible price response.
Storage tanks stabilize prices by feeding previously produced barrels into the market.
Only after inventories have been drawn down does the shortage fully appear in price.
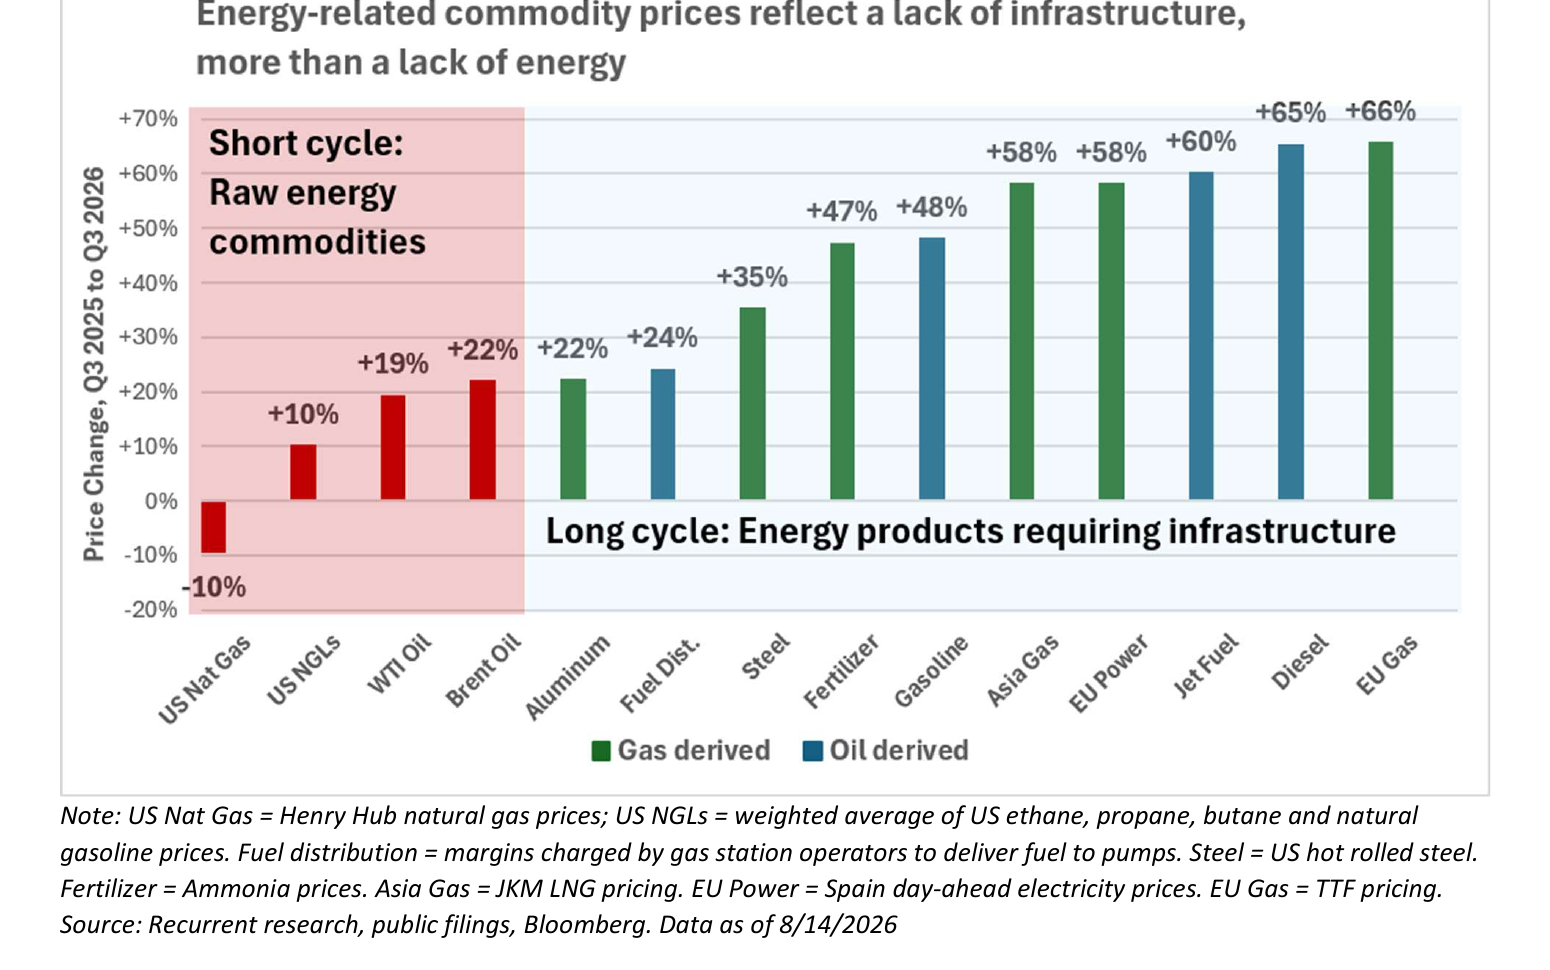
Borrowed supply is not new supply. During the Iranian Revolution, stocks were drawn rapidly to stabilize prices. The larger oil-price move came only after storage tanks had been drawn down and the cushion could no longer absorb the shortage.
Oil can still be buffered by inventories and a relatively fast supply response. Refineries, LNG plants, pipelines, power plants, smelters, and mines cannot. In the current energy complex, the long-cycle products have done the inflating. Those prices are the capex deficit showing up.
That is why the 2023–25 disinflation is the dangerous part of the rhyme. In the mid-1970s the respite arrived before the supply response. Capex stayed timid. Inflation returned with ordinary growth.
If you think the Fed already did the hard part, you are betting that a shortage disappears without anyone building the missing assets. History is not kind to that bet.