
The 1970s were not one long oil bull market
It is easy to remember the 1970s as a decade of continuously rising oil prices. The actual history was much messier.
After the 1973-74 oil shock, the market spent several years worrying about too much supply, not too little. Conservation slowed demand growth, while new production arrived from places like Alaska and the North Sea. By 1977 and 1978, energy had largely fallen off the front pages and OPEC was openly discussing excess supply.
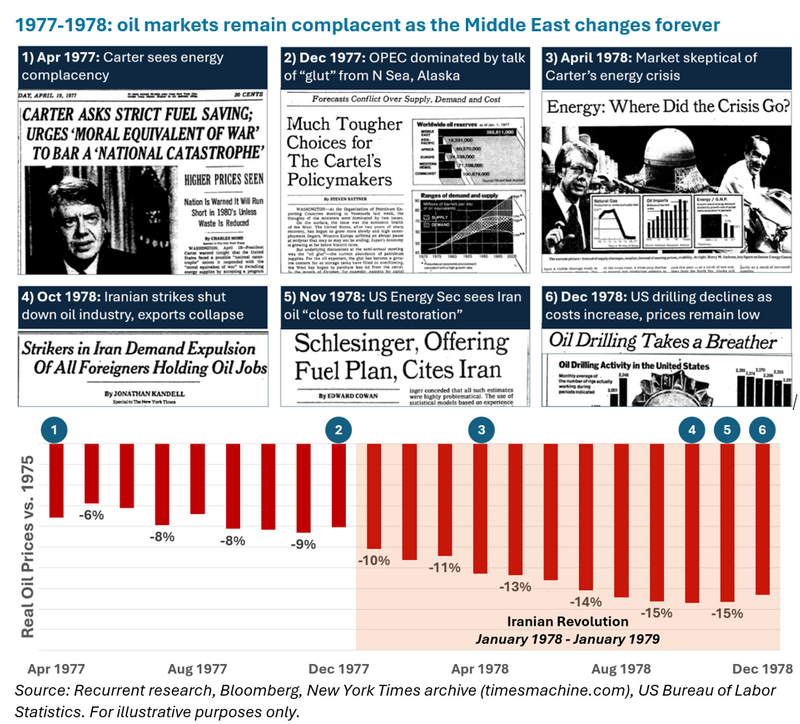
Real oil prices reflected that complacency. They fell through much of 1978 even as the political situation in Iran deteriorated.
Oil stayed weak even as Iranian exports collapsed
The Iranian Revolution had been building throughout 1978. In October, Iranian oil workers went on strike and roughly 5-6 million barrels per day of exports were effectively removed from the market.
Even then, oil prices did not behave the way most people remember them.
The Shah fled Iran in early 1979, yet U.S. refiners were still paying roughly 15% less for oil in inflation-adjusted terms than they had in 1975.
Why? The market kept expecting normalization. Other producers increased output, inventories were drawn down and policymakers repeatedly expressed confidence that Iranian exports would recover. The working assumption was that once the immediate political crisis ended, the oil problem would end with it.
The bigger price move came after the revolution
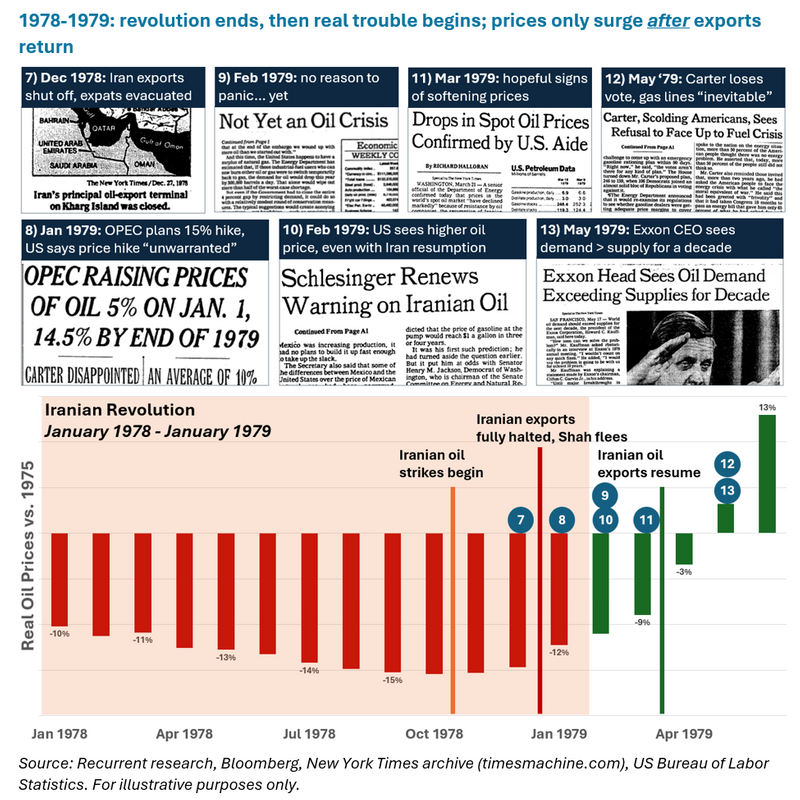
Iranian exports did begin to return in 1979. But instead of resolving the problem, normalization exposed how much the market had changed.
Inventories had been depleted. Other producers had already increased supply during the crisis. Iranian production recovered, but not to its prior level. At the same time, production growth elsewhere was disappointing and some large producers were beginning to face declines.
By the end of the first quarter of 1979, the market was starting to recognize that the supply cushion of the late 1970s was gone. By mid-year, shortages had become a much more mainstream concern.
So the major oil-price move associated with the Iranian Revolution came with a lag. Prices remained surprisingly calm during much of the crisis, then reset higher after the situation appeared to be stabilizing.
What 1979 may tell us about 2026
We are not arguing that 2026 has to replay 1979. The analogy is more useful as a reminder of how commodity markets can behave during and after a disruption.
Coordination is often easiest during the crisis itself. Producers stretch output, inventories are drawn down and buyers postpone purchases while they wait for conditions to normalize.
The harder question comes afterward. Inventories need to be rebuilt, emergency supply responses fade and producers have to decide whether higher prices are durable enough to justify new investment.
That matters even more in a market where capital spending has remained restrained.
The key point is that resolution is not always bearish. Sometimes the end of the immediate crisis is when the market finally discovers how little spare capacity was available in the first place.
This research note is adapted from Recurrent Investment Advisors’ May 2026 Monthly Investment Commentary.