
What happened to the all-EV future?
Battery costs fell. Electric-vehicle sales grew. The all-EV future did not arrive.
In 2017 the loud forecast was simple: batteries keep collapsing, EVs take the fleet, oil demand falls. We thought the cost curve would slow as it hit materials, that cheap cars would electrify last, and that the oil market was much larger than the gasoline barrel.
EV adoption was not the investment conclusion.
Materials, cheap-car economics, fleet uptime, and the rest of the barrel.
The market was debating how fast EVs would grow — and what that meant for oil.
In 2017, the claim was that EV cost declines were becoming exponential, and this would translate into exponential market share gains.
Elon Musk forecast that more than half of new U.S. vehicle production would be electric inside a decade.
Continued exponential battery-cost declines were the foundation.
BNEF saw battery costs falling from about $273/kWh in 2016 to roughly $73/kWh by 2030. Tony Seba went much further: roughly $50/kWh by 2027 and $30–35/kWh by 2030. Musk saw those economics translating into more than half of new U.S. vehicle production becoming electric within a decade.
That became an oil-demand forecast.
BNEF’s 2017 outlook did not stop at market share. It put a barrel figure on the page: EVs taking 54% of new sales and knocking out about 8 million barrels a day of transport fuel by 2040.
IEA's Sustainable Development Scenario (SDS) held that oil's demand peak was already here, and the future was one long decline.
The goals-based case put oil demand at about 73 mb/d by 2040, with an EV stock approaching 875 million.
Capital was moving with the transition narrative.
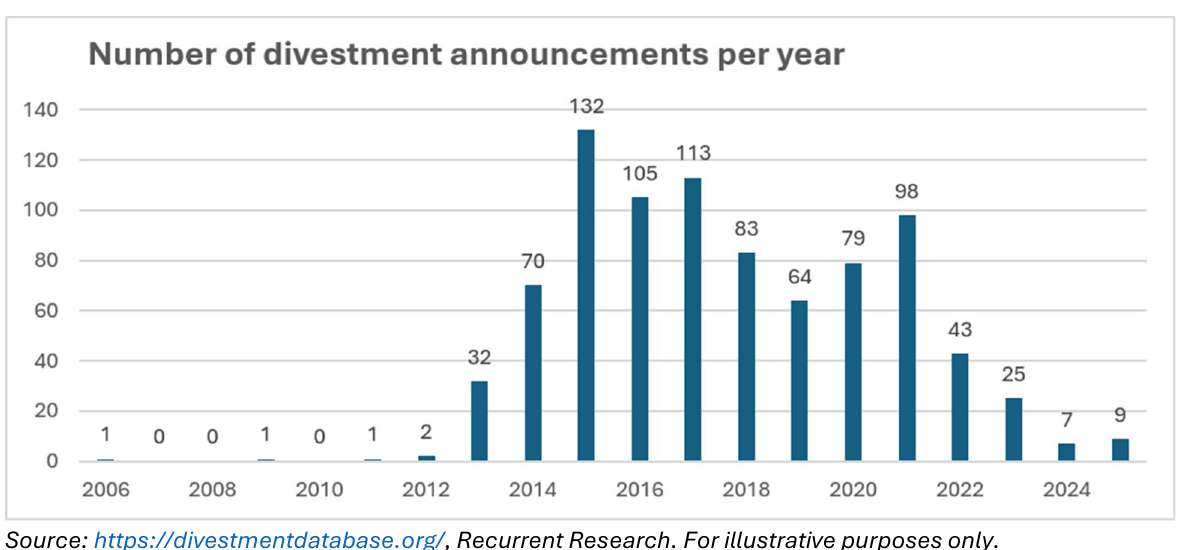
Institutional investors were moving to divest oil and gas, reflecting a rapid transition. Meanwhile, capital was being recycled into the "continued exponential improvements" forecasted in cleantech.
In 2017, we took a radically different view of the EV transition.
We expected EVs to grow and batteries to get cheaper. We did not expect an all-EV sales mix, and we did not expect the oil market to shrink.
Battery manufacturing could keep improving, but raw materials would not follow the same exponential curve. The battery would stay expensive in a cheap car. Charging time would punish any vehicle that had to earn its keep. Most of the oil barrel did not live in a passenger tank.
The cost curve slowed as the battery became a raw-material problem.
Raw material costs stood in the way of continued exponential progress - but nobody in Silicon Valley had ever looked at raw material value chains before.
Our 2017 forecast had a different shape. Battery costs would keep falling, but the rate of decline would slow as raw materials became a larger share of the battery. We modeled a gradual glide toward roughly $90/kWh by 2030.
We forecast a gradual decline in battery costs, not an exponential collapse.
Our 2017 forecast was not a 2025 price target. We modeled battery costs declining gradually toward roughly $90/kWh by 2030 as manufacturing gains slowed and raw materials became a larger share of the cost.
BloombergNEF’s 2025 survey put BEV batteries at $99/kWh. That is still close to the gradual path we forecast. There was no exponential break toward $30 — even after lithium prices collapsed.
Batteries stayed expensive. As we forecasted in 2017, that cost was easiest to hide inside a higher-priced vehicle.
The battery was easiest to hide in an expensive car.
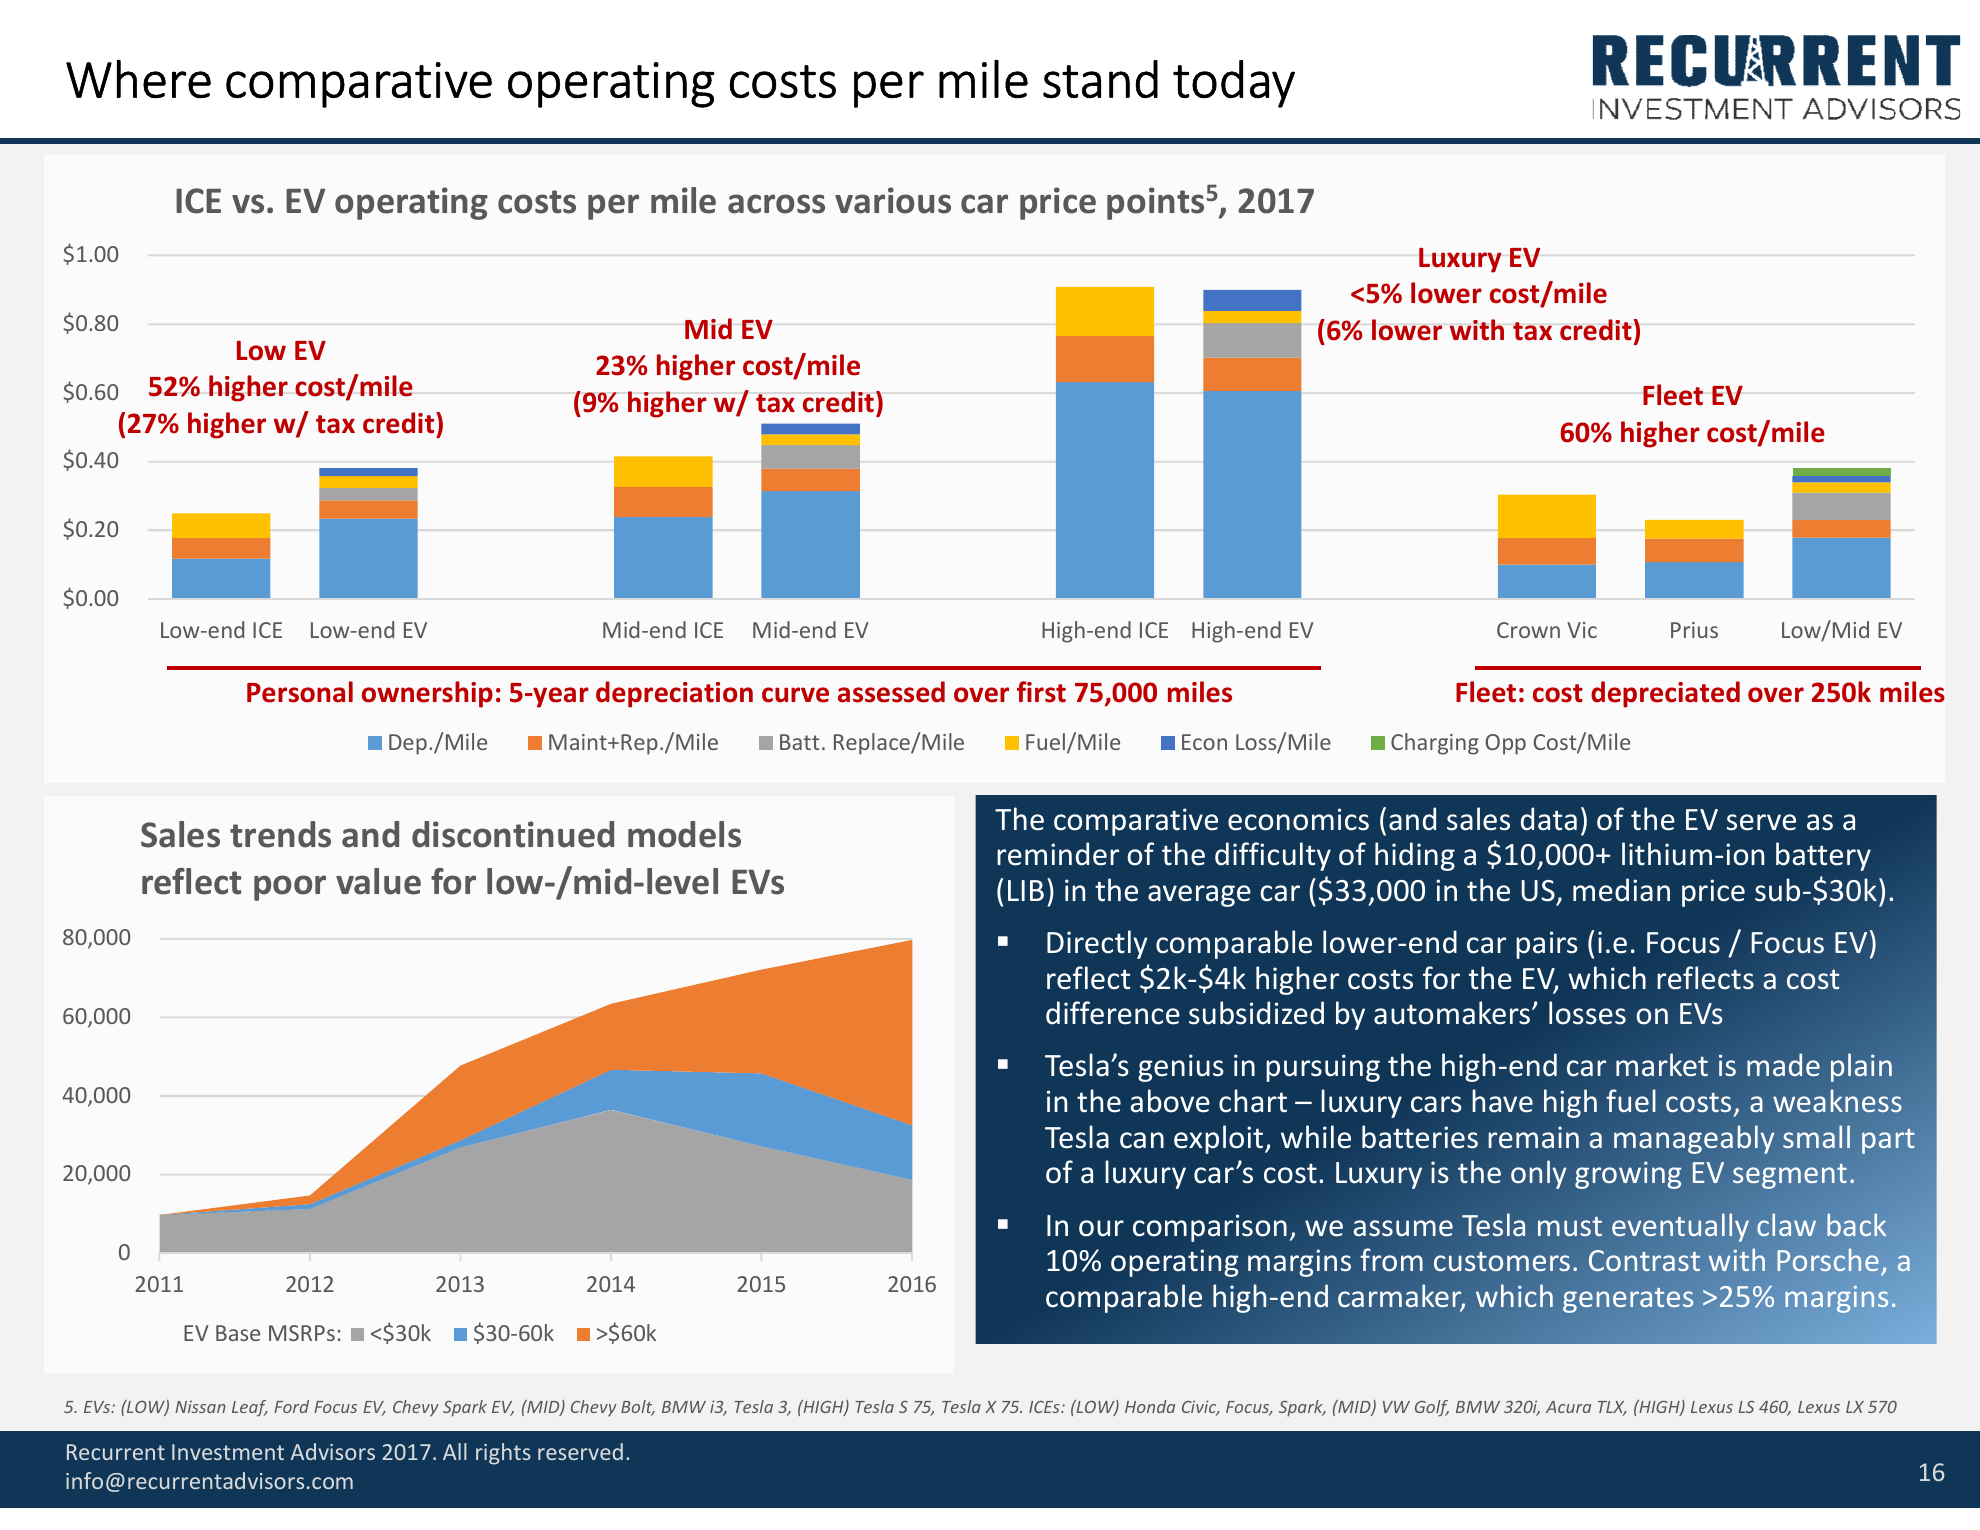
Our 2017 model split the market into economy cars below $30,000, mid-priced cars from $30,000–$60,000, and luxury cars above $60,000. The same battery produced very different economics across those price points.
We modeled three very different EV markets.
Economy cars below $30,000. Mid-priced cars from $30,000–$60,000. Luxury cars above $60,000 — all based on 2017 MSRP. The same battery that overwhelmed the economics of an economy car could disappear into the cost structure of a luxury car.
Economy cars — below $30,000 in 2017 — were nowhere close to parity.
In our model, an unsubsidized economy EV ran about 52 percent higher cost per mile than a comparable combustion car. A five-figure battery was simply too large a cost to hide in a sub-$30,000 vehicle.
Mid-priced cars — $30,000–$60,000 — were better, but still not at parity.
The battery mattered less as the vehicle price rose, but our 2017 model still put an unsubsidized mid-priced EV about 23 percent above the cost per mile of a comparable combustion car.
Luxury cars — above $60,000 — were already roughly cost-competitive.
At luxury price points, the battery became a manageable share of the vehicle cost, while expensive combustion cars offered unusually large fuel savings for an EV to capture. In our 2017 model, luxury EVs were already roughly cost-competitive.
Tesla started at the top of the market for a reason: luxury was not simply branding. It was where the battery was easiest to hide.
Roughly 80% of a car’s cost had nothing to do with fuel.
Cheaper fill-ups were being asked to do an enormous amount of work.
BNEF’s 2017 outlook put unsubsidized sticker parity in the late 2020s. But fuel was only one part of the economics. Roughly 80% of the cost of owning a car had nothing to do with fuel.
In addition to forecasting a slower decline in battery costs, we thought it was a mistake to assume cheaper fueling alone could transform what people bought and how they used cars in under a decade.
We focused on key cost components of the vehicle that tech futurists didn't bother to analyze.
Depreciation, repairs, resale value, battery replacement and downtime all remained part of the ownership calculation. Cheaper fueling was real. It was not the whole economic system around the car.
A long-lived electric drivetrain did not guarantee strong resale value.
EVs now sit alongside luxury combustion cars among the fastest-depreciating vehicles in the market. iSeeCars estimates the average EV loses 57.2% of its value over five years.
Tesla's repeated new-car price cuts made the mechanism especially visible: the battery did not suddenly deteriorate. The market price of the used car changed. That was our 2017 point — depreciation is a supply-and-demand outcome, not an engineering-life estimate.
For a revenue-producing vehicle, downtime is a real cost.
Forecasters saw fleet operators as natural early adopters of EVs.
High mileage meant more fuel savings, lower maintenance costs looked attractive, and autonomy was expected to arrive quickly enough to lift utilization further.
Recurrent saw that charging = 80–100 minutes/day lost for a highly utilized fleet vehicle, making EVs less desirable for high-runtime applications.
In 2017, charging a 150–200 mile battery to 80% could take roughly 40 minutes. For a vehicle whose economics depend on staying on the road, that charging time was itself a meaningful operating cost.
Autonomy did not solve the problem. A driverless vehicle sitting at a charger was still not producing revenue.
24-hour taxis and rental car companies quickly saw that EV hurdles were largely insurmountable.
Hertz cut 30,000 EVs after customer demand, damage costs and poor residual values hurt the economics.
Depot-charged delivery vans are different. They return to the same place every night and can charge during planned downtime.
We did not forecast that EVs would fail. We forecast that oil demand would keep growing anyway.
That was a consequential call in 2017. Peak-oil-demand forecasts were moving rapidly into the investment mainstream, and fossil-fuel divestment was accelerating. The IEA Sustainable Development Scenario put 2040 oil demand near 73 million barrels a day.
Our argument was not that electrification would be irrelevant. It was that EVs would slow gasoline-demand growth without shrinking the much larger oil market. Nine years later, we can test that forecast against what actually happened.
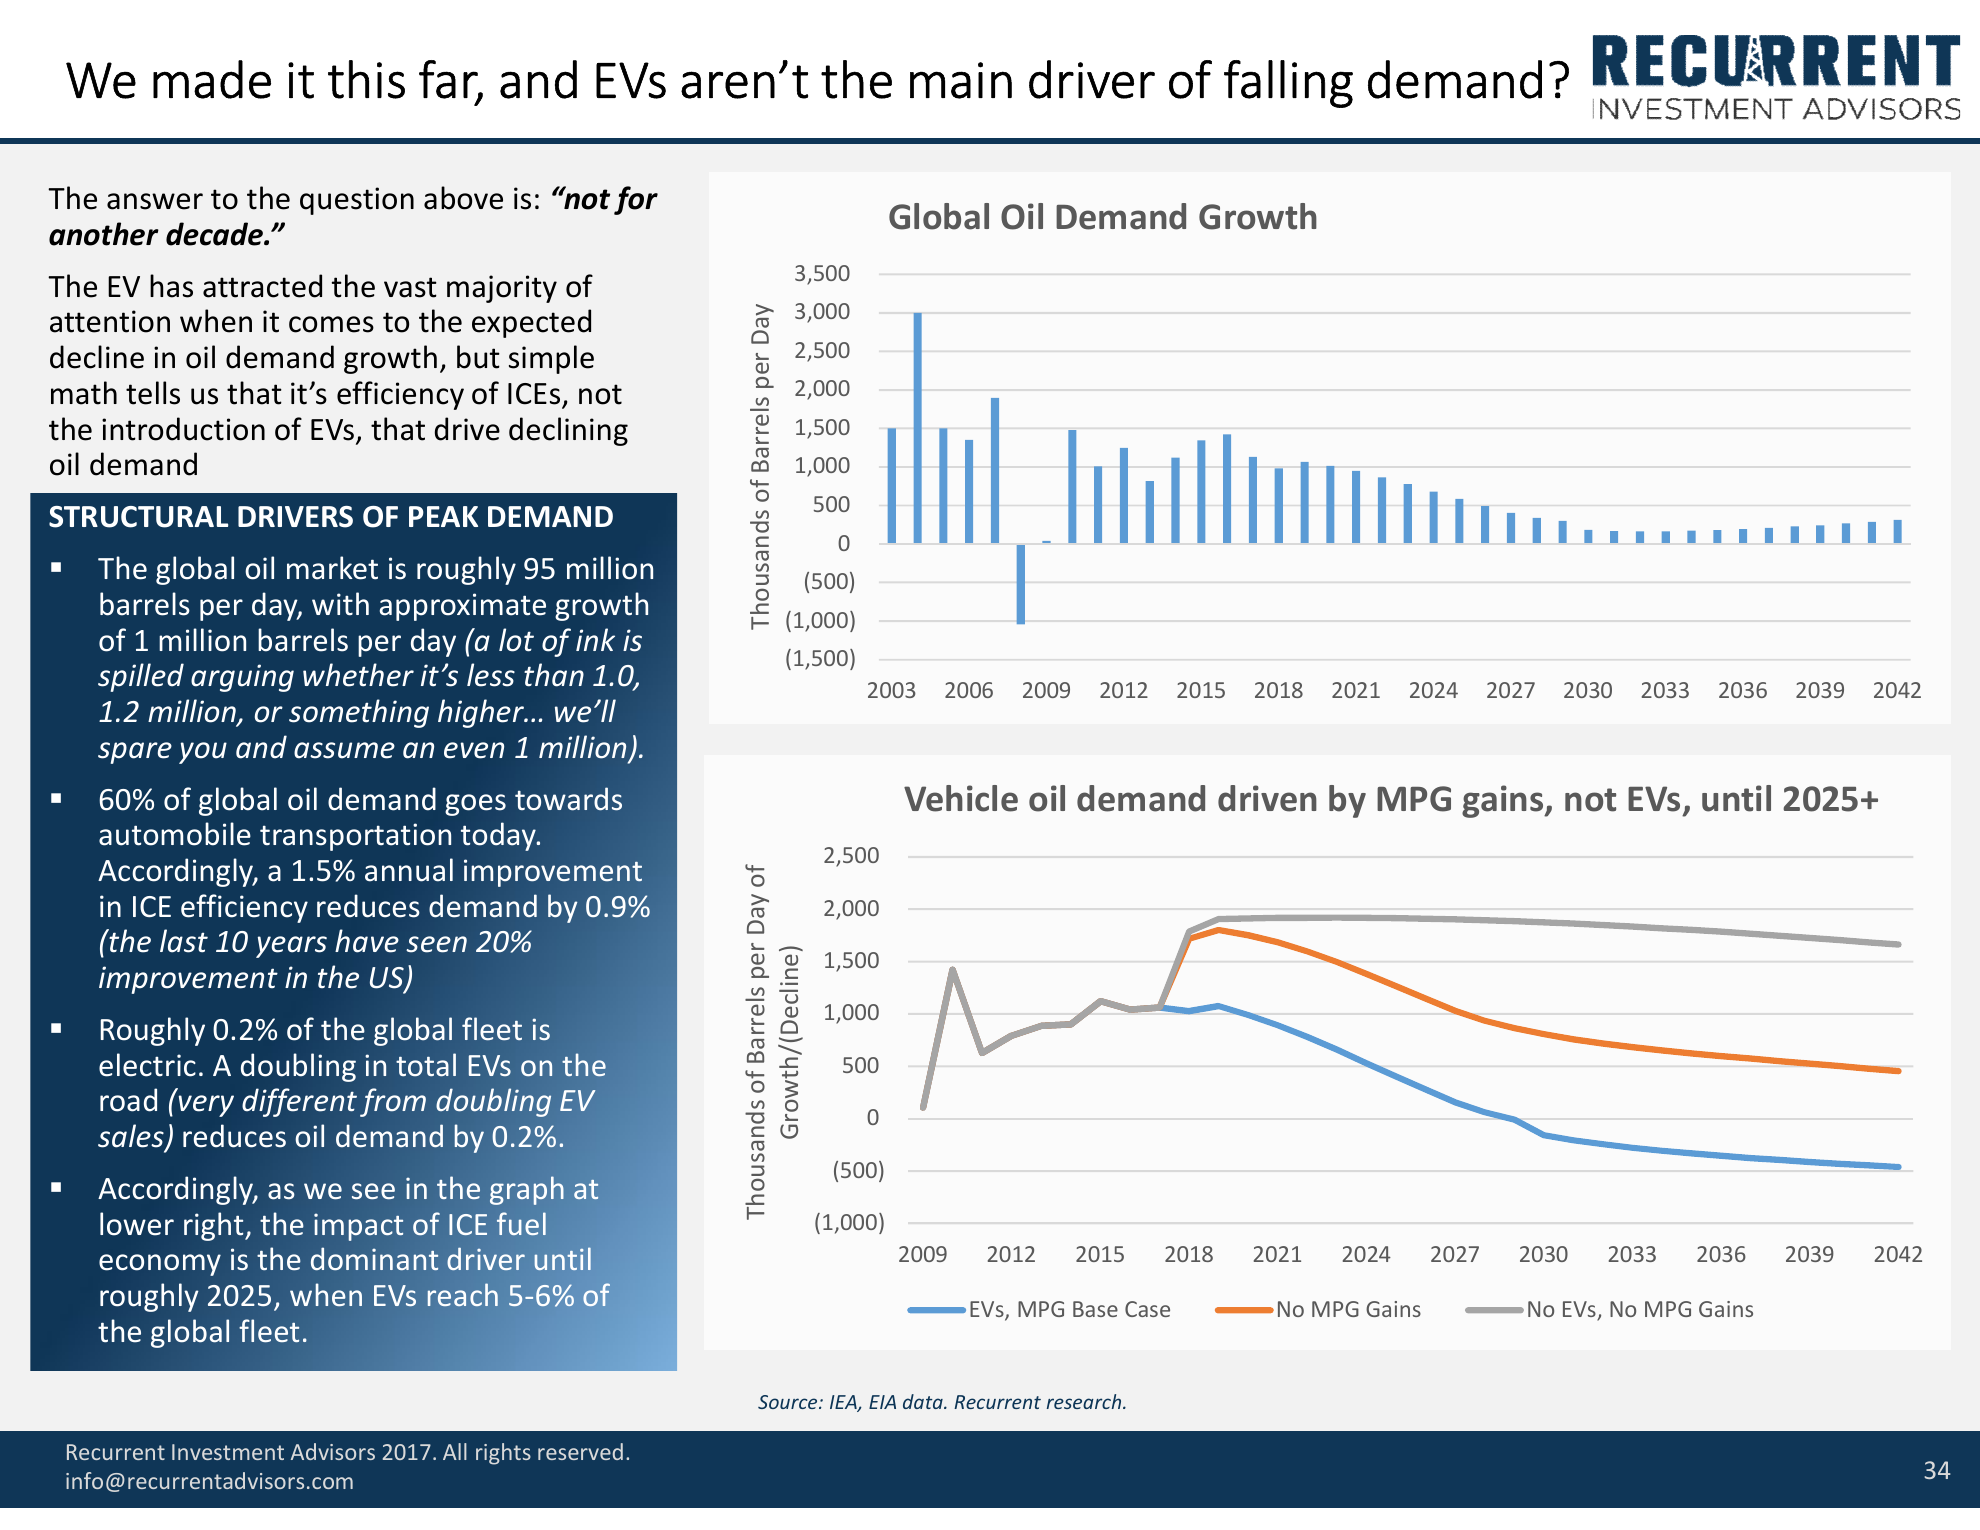
In 2017, the contrarian forecast was not about EV market share. It was that oil demand would keep growing.
EV share was the input. The size of the future oil market was the investment conclusion.
We did not publish a 36-page EV report because we wanted to win a debate about cars. In August 2017, with peak-demand forecasts gaining credibility and divestment accelerating, we forecast that global oil demand would still grow to roughly 106 million barrels a day by 2040.
That was the bet: EVs could become important without making the oil market smaller.
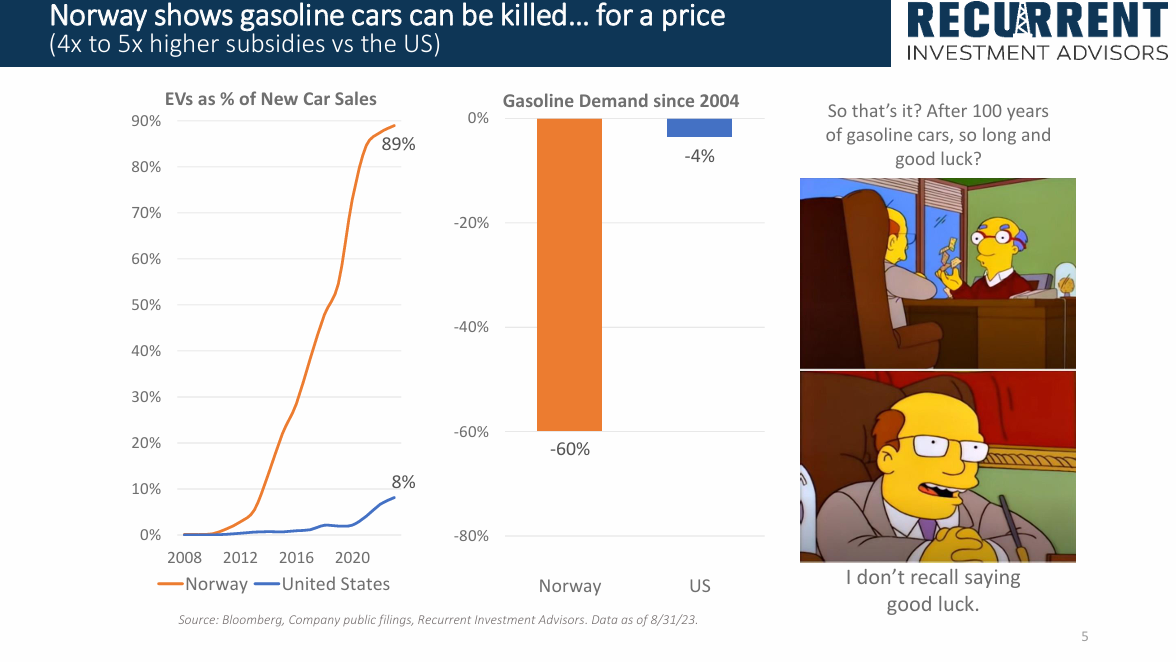
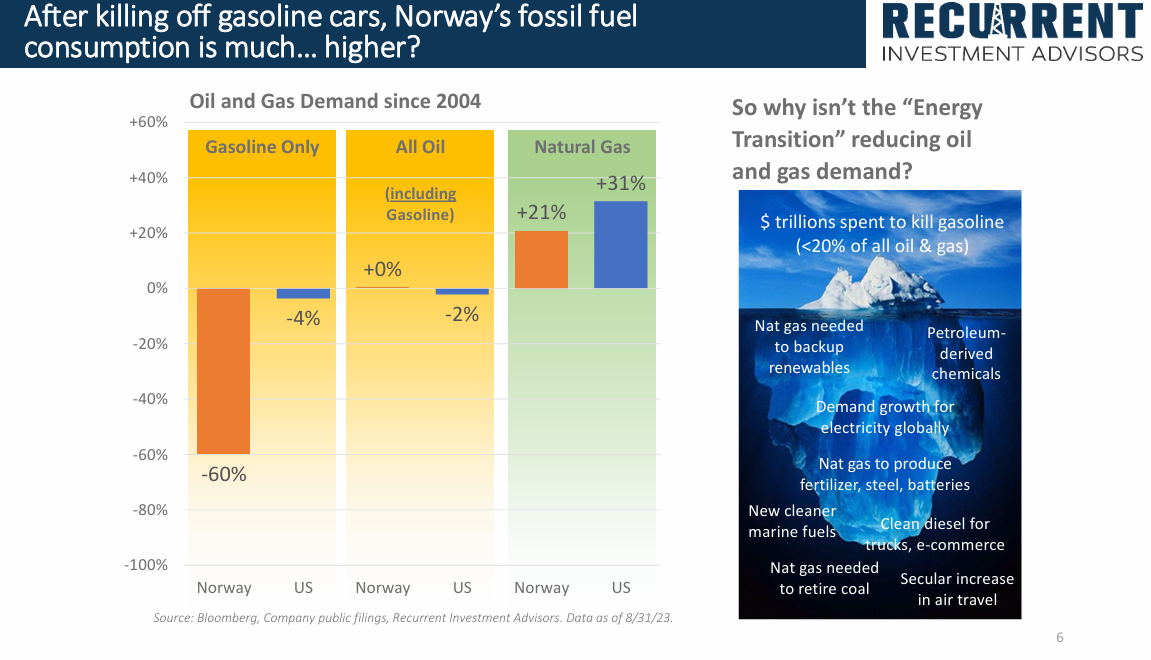
Even in markets where the EV future was more fully realized, oil demand did not meaningfully shrink!
China, along with Norway and several European countries, delivered on some, if not most, of the aggressive EV projections we analyzed in 2017. Gasoline demand fell sharply. Overall oil demand did not. Depending on the market, it remained roughly flat or continued to grow.
Part of the reason is the counterfactual. EVs did not replace a frozen fleet of 2017 gasoline cars. They displaced cars that were themselves becoming more efficient, including hybrids. If the next buyer would otherwise have chosen a 50-mpg small car or hybrid, electrification removes much less gasoline than a comparison with the old fleet suggests.
Gasoline declines, but the rest of the barrel grows, perhaps even faster.
Aviation, petrochemicals, LPG, diesel. Passenger gasoline can fall hard without taking the whole barrel with it. China became the clearest large-scale example: transport electrified far faster than we forecast, while petrochemical and other oil demand kept the total market growing.
We saw slowing demand growth, but no demand decline - reality has proved out our thesis.
Our 2017 forecast had oil-demand growth slowing from roughly 1.8% to roughly 0.8%. We did not think that was the same thing as demand destruction. The 2017 forecast still had the global oil market around 106 million barrels a day by 2040.
In 2017, our forecast of continued, modest oil demand growth felt radical - in reality, 2026 demand has already reached roughly our 2040 forecast level.
Our August 2017 forecast put global oil demand near 106 million barrels a day in 2040. The IEA Sustainable Development Scenario put 2040 demand near 73 million barrels a day.
By late 2025, observed liquids demand was already about 104.6 million barrels a day, within 1.4 mb/d of our 2040 forecast. The scale of the original disagreement is no longer theoretical.
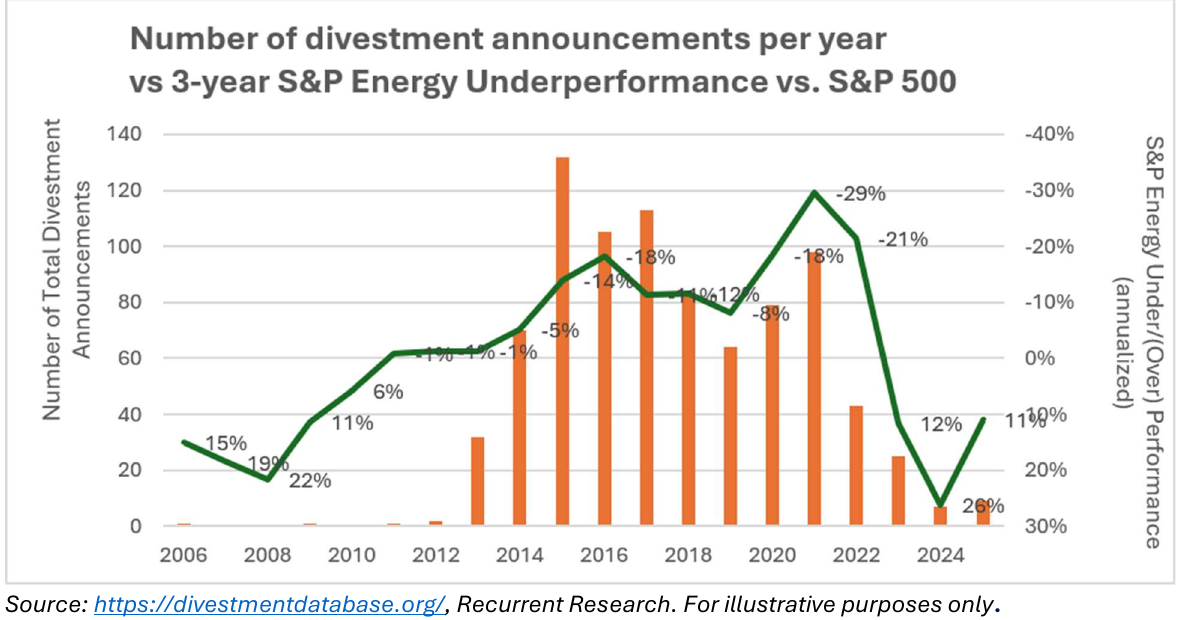
The 2017 narrative changed capital allocation. Nine years later, the investment outcome looked very different.
Poor energy returns mattered too.
Climate policy supplied one argument. Performance supplied another. For every year from 2011 through 2022, rolling three-year energy returns lagged the S&P 500.
The deepest three-year underperformance overlapped with the heaviest years of divestment announcements from 2014 through 2021.
After the shocking outperformance of energy in 2022, the reversal of the ESG/divestment movement began.
In calendar 2022 the S&P Energy sector rose 65.7 percent. The S&P 500 fell 18.2 percent. Institutions that had removed energy from their portfolios missed the strongest sector in the index.
However, the opportunity cost of missing out on energy's strong post-COVID returns has been offset by the fact the sector remains a small piece of most investor indices. Princeton's June 2026 reversal was an early institutional marker that the divestment thesis itself was beginning to unwind.
As Recurrent predicted in 2017, EVs’ impact on oil demand was dramatically less than feared.
Meanwhile, cleantech-inspired fears of oil demand collapse drove broadly lower valuations across energy. These lower valuations have reduced capex, and led to capacity reductions in key subsectors of the energy industry, such as refining.
The impacts from the mismodeling of the EV transition, so prevalent in the late 2010s, continue to contribute to inflationary energy market dynamics today.
2017 market-narrative examples: Elon Musk, National Governors Association, 15 July 2017 (>50% of new U.S. vehicle production electric within 10 years; almost all new cars autonomous); BloombergNEF 2017 battery-cost forecast (about $273/kWh in 2016 to $73/kWh by 2030) and Electric Vehicle Outlook 2017 (Colin McKerracher); Tony Seba, Clean Disruption / RethinkX exponential battery-cost path (roughly $50/kWh by 2027 and about $30–35/kWh by 2030). IEA Sustainable Development Scenario: about 73 mb/d of oil demand by 2040 and EV stock approaching 875 million. 2025 battery costs: BloombergNEF survey. China fuel-demand context: IEA, March 2025. Divestment: divestmentdatabase.org and Recurrent Research, updated May 2026.