
Recurrent lookback · 2017 / 2025 / 2026

Shale altered oil’s dispatch curve and ultimately Frack-tured OPEC’s Cartel

Shale did not just add barrels. It changed the shape of the oil market: shorter cycles and lower amplitude. OPEC can still announce cuts — but it cannot control price.

In 2017 we argued that U.S. shale had added a fast-response source of supply capable of changing the oil cycle itself. In 2025 we went back to the tape. In 2026, history handed the framework its hardest stress test yet.

2017 Thesis
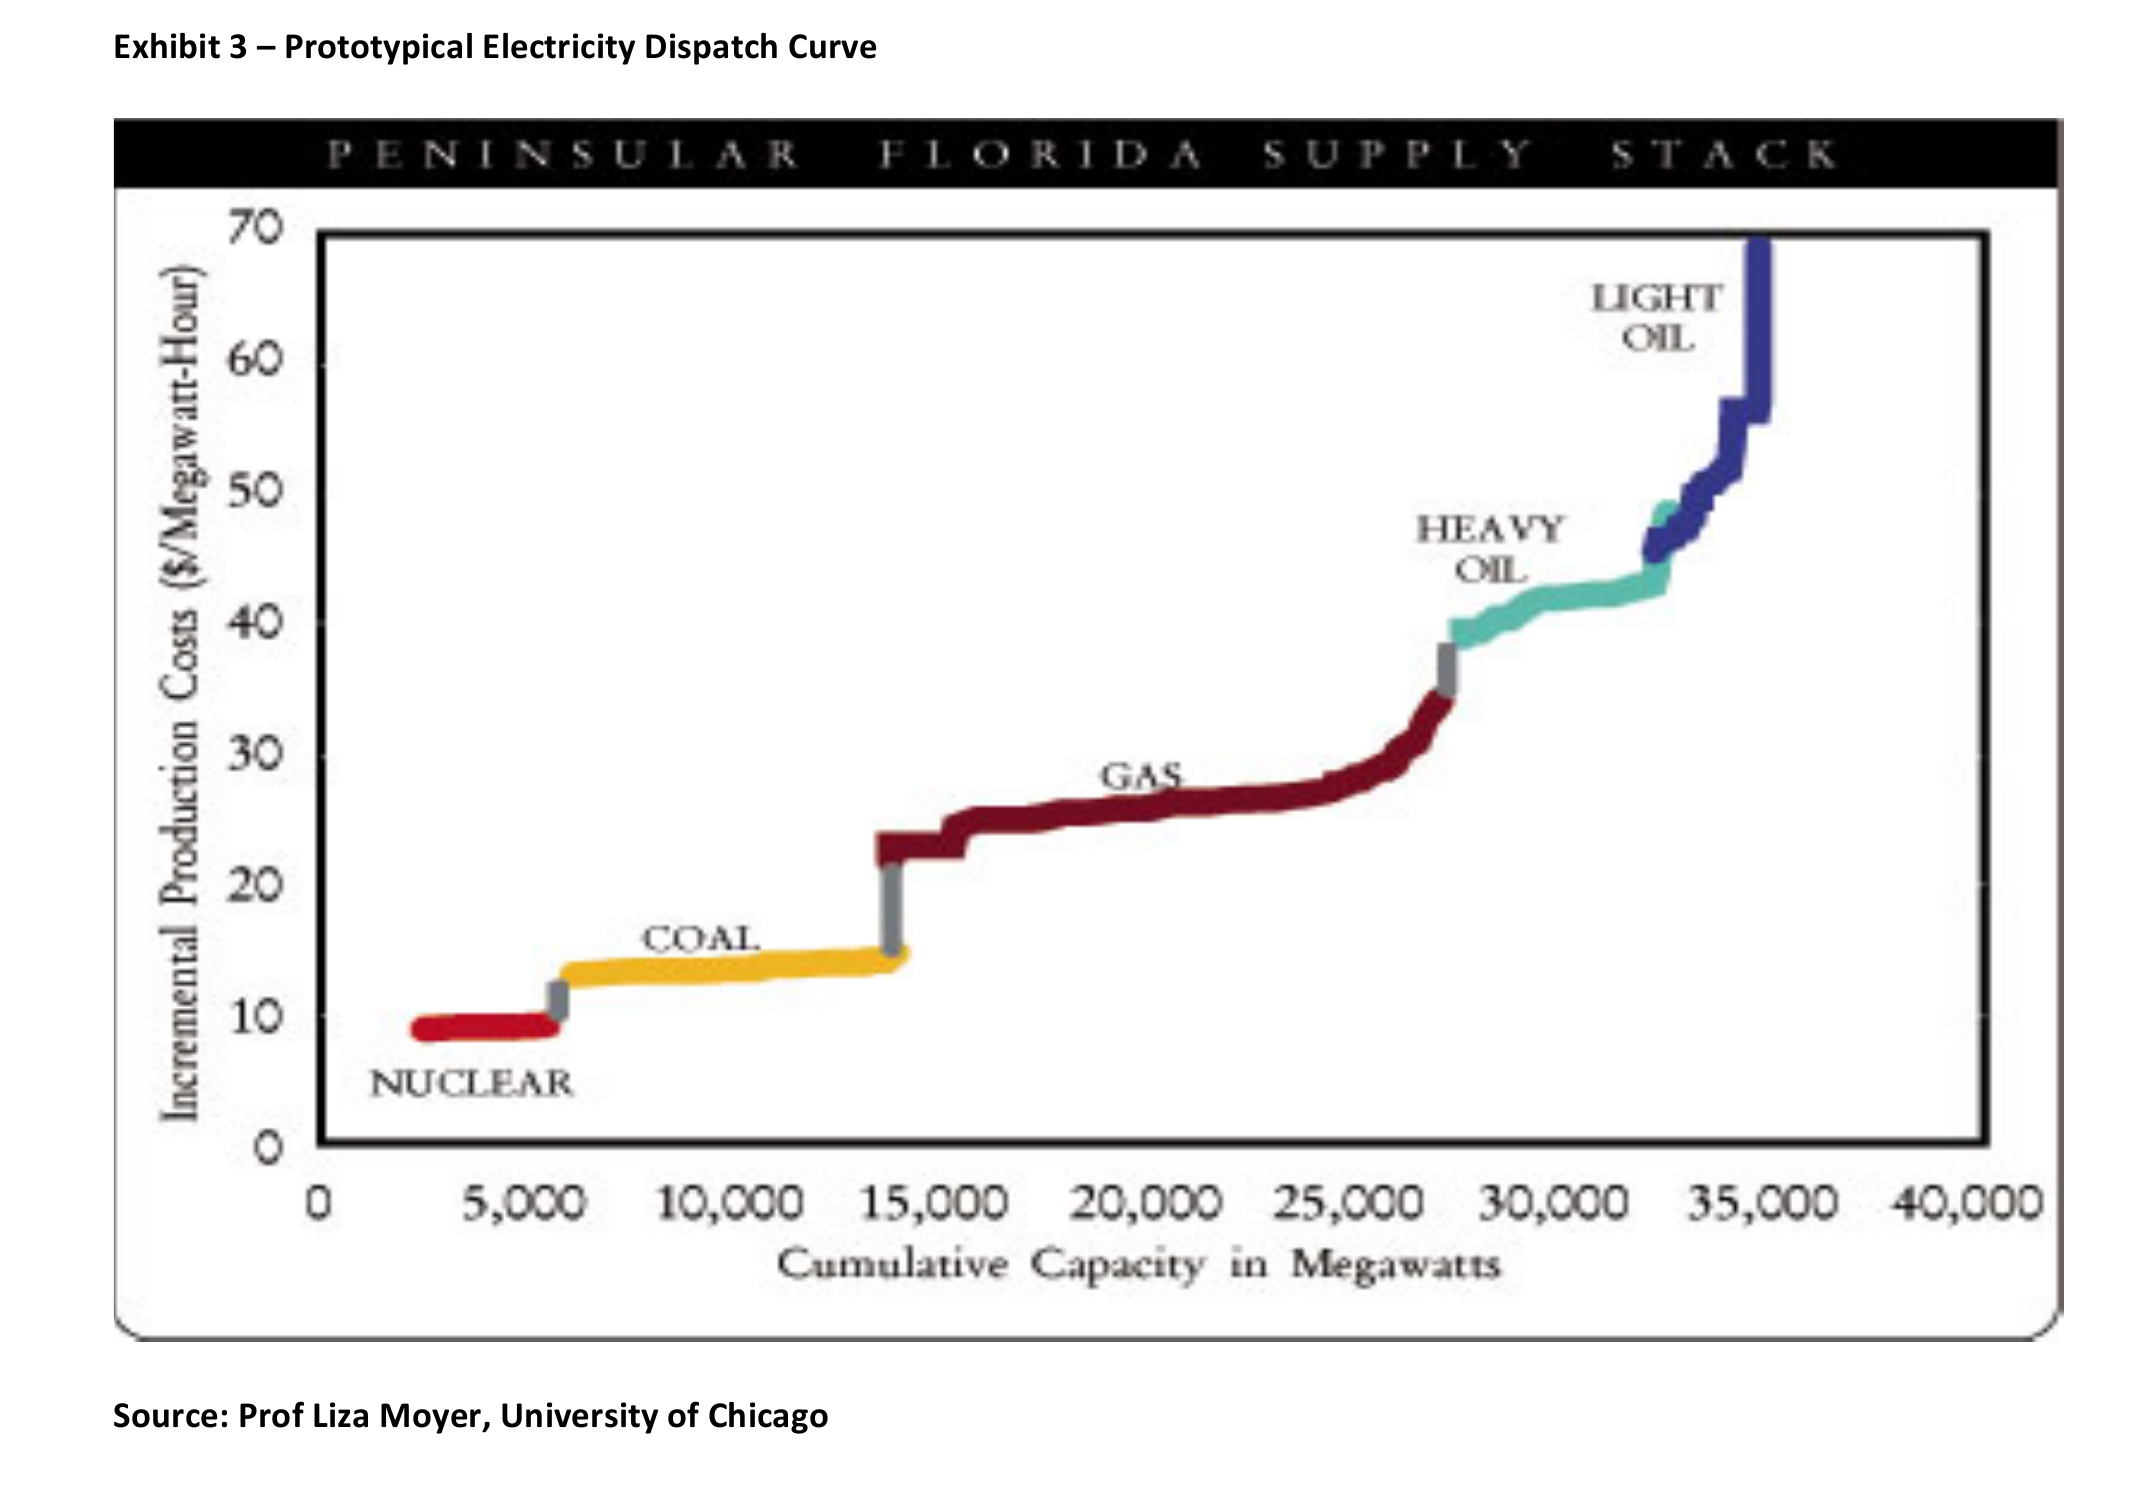
Oil now has a dispatch curve
2017 Exhibit 3: prototypical electricity dispatch curve
Exhibit 3 · Prototypical electricity dispatch curve Recurrent Research · 2017
2017 Thesis
The decline curve is the off-switch
~70%

First-year decline on a typical Bakken well. That is why shale can shrink as fast as it can grow.

Typical Bakken first-year decline · Hughes GSR
Exhibit 2 · Typical Bakken decline Hughes GSR · Recurrent Research · 2017
2017 Evidence
The first live test: 2014–17
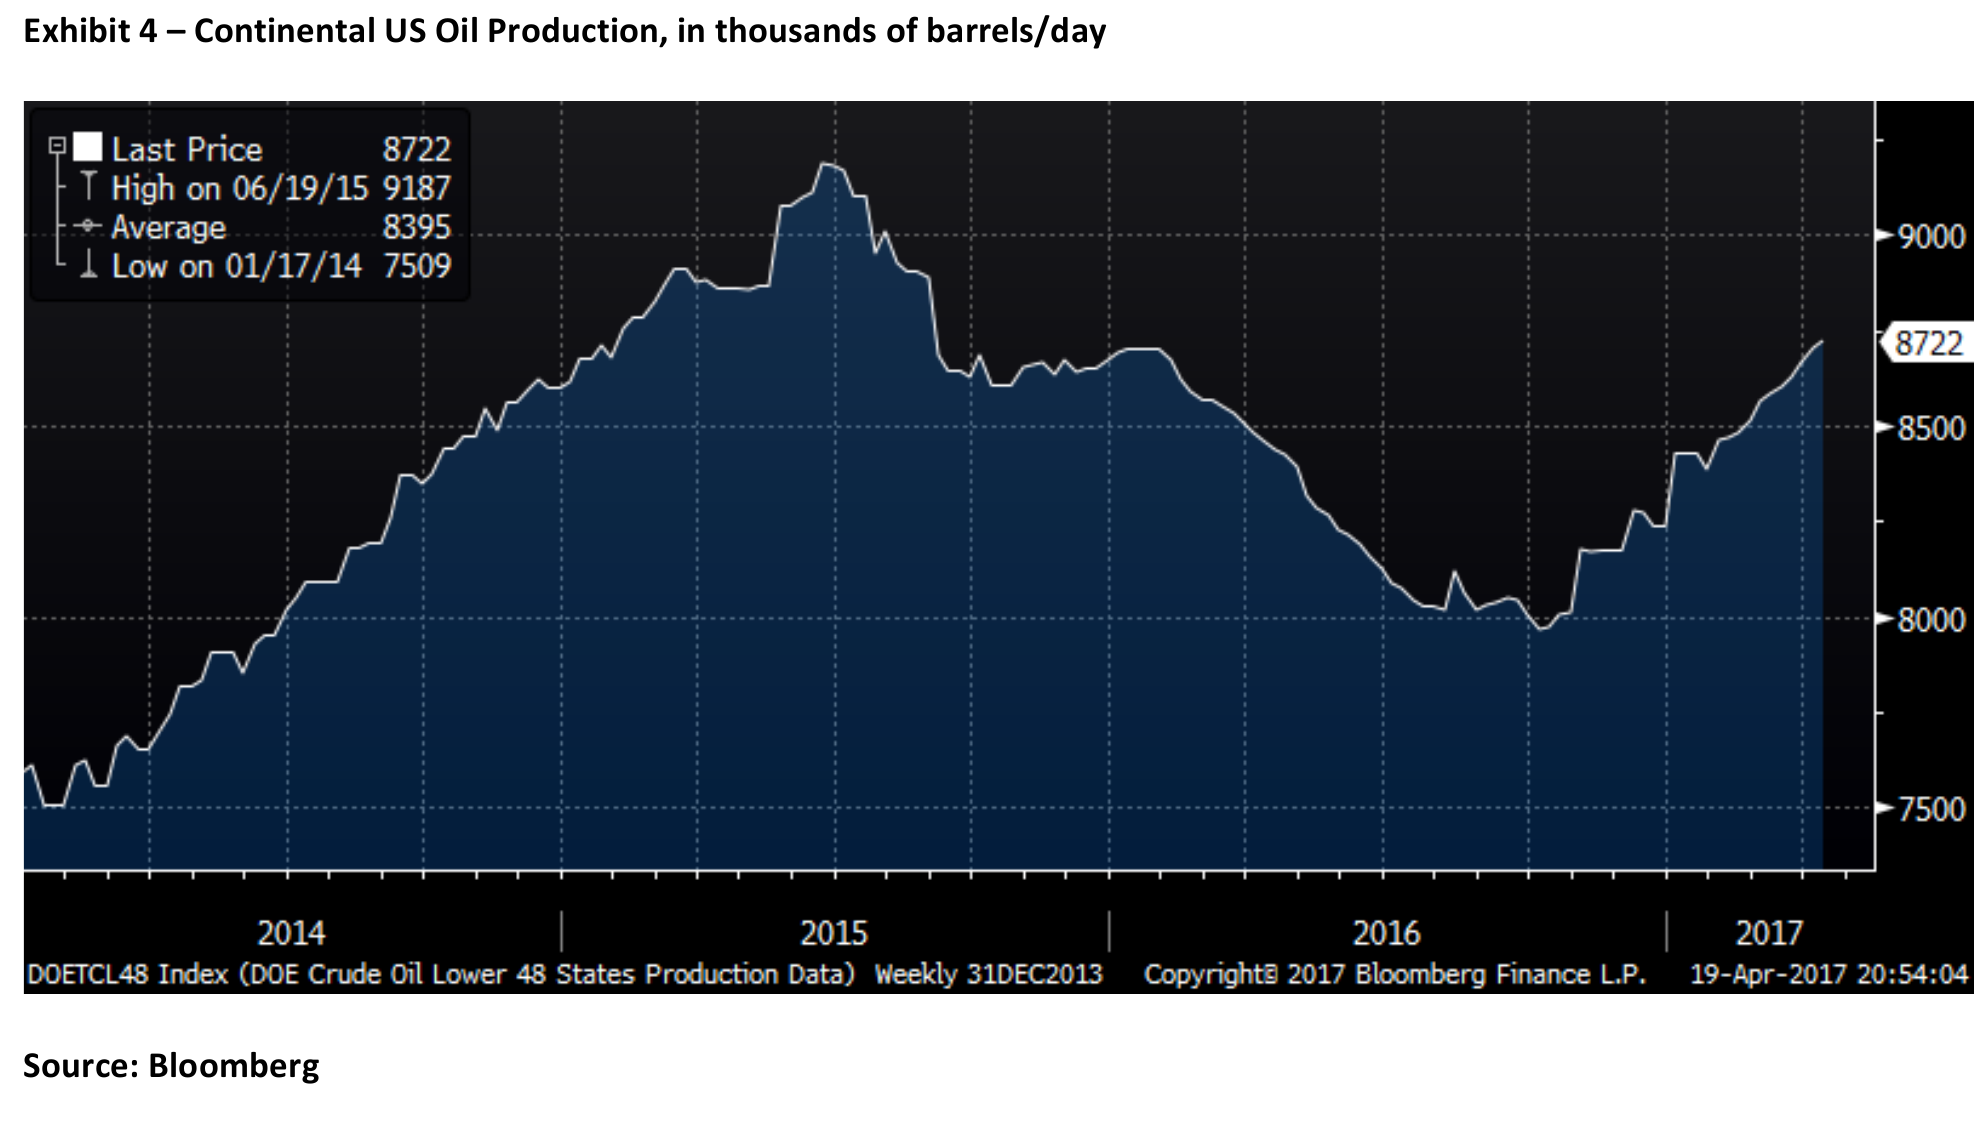
2017 Exhibit 4: continental U.S. oil production, 2014 to 2017
Exhibit 4 · Continental U.S. oil production Bloomberg · Recurrent Research · 2017
2017 Thesis

Oil now has a dispatch curve

In power markets, plants stack by cost. Nuclear and coal stay on. Gas peakers take the last increment of demand, then turn off.

Shale sits at the high-cost, fast-response end of the oil stack — the peaker plant. Saudi barrels are the baseload. The inverse still holds: lowest cost is slowest to move; highest cost is fastest.

2017 · The Impact of Shale on Energy Cycles · Exhibit 3
2017 Thesis

The well itself is the off-switch

A Bakken well can decline about 69% in year one, 39% in year two and 26% in year three. Stop drilling, and production falls quickly.

OPEC changes supply by negotiation. Shale changes supply by not completing the next well.

2017 Exhibit 2 · typical Bakken decline
2017 Evidence

The first live test: 2014–17

Price broke in 3Q 2014. Lower-48 production peaked within a year, then fell about 1 million barrels a day. Price troughed in 1Q 2016. Production bottomed 6–8 months later and turned up.

That U-shape is what changed the oil market. The market no longer had to wait years for a long-cycle project — or for a cartel meeting — to rebalance.

2017 Exhibit 4 · Bloomberg Lower-48
2025 · Back to the Tape
8 years of
evidence

Did oil really become shorter-cycle and lower-amplitude?

That was the real prediction embedded in our 2017 framework. By 2025, we finally had enough history to test it.

And the intervening period could hardly have been a more demanding test. From 2017 through 2025, the oil market absorbed a once-in-a-century pandemic and negative WTI, attacks on Saudi infrastructure, Russia’s invasion of Ukraine, sanctions, repeated OPEC+ interventions, trade conflict and escalating war across the Middle East.

Arguably, the geopolitical backdrop was as extreme as anything oil had experienced since the 1970s. The headlines were not calmer. They may have been crazier.

If shale had not changed the structure of the oil cycle, these eight years should have exposed us.
2019
Attack on Saudi oil infrastructure
2020
COVID collapse and negative WTI
2022
Russia invades Ukraine
2017–25
Repeated OPEC+ interventions
2023–25
Escalating Middle East conflict
2025 Scorecard
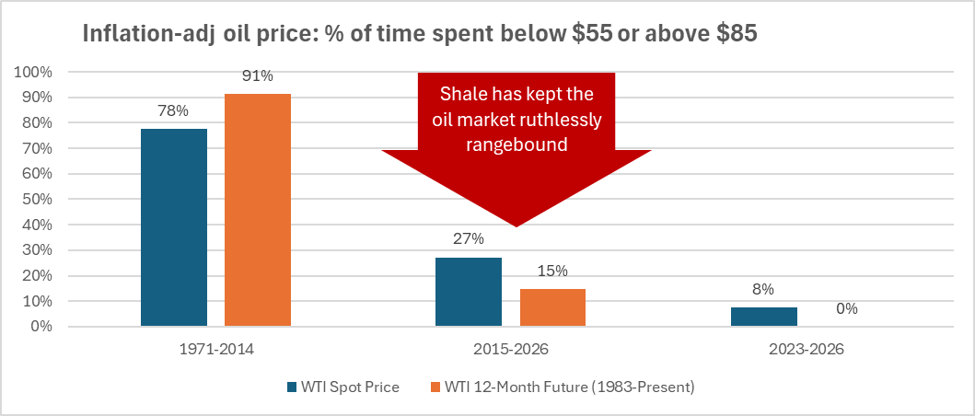
Extreme prices became rarer
Inflation-adjusted oil price: share of time spent below $55 or above $85
Inflation-adjusted WTI · share of time outside $55–$85 Bloomberg · Bureau of Labor · Recurrent Research
2025 Scorecard
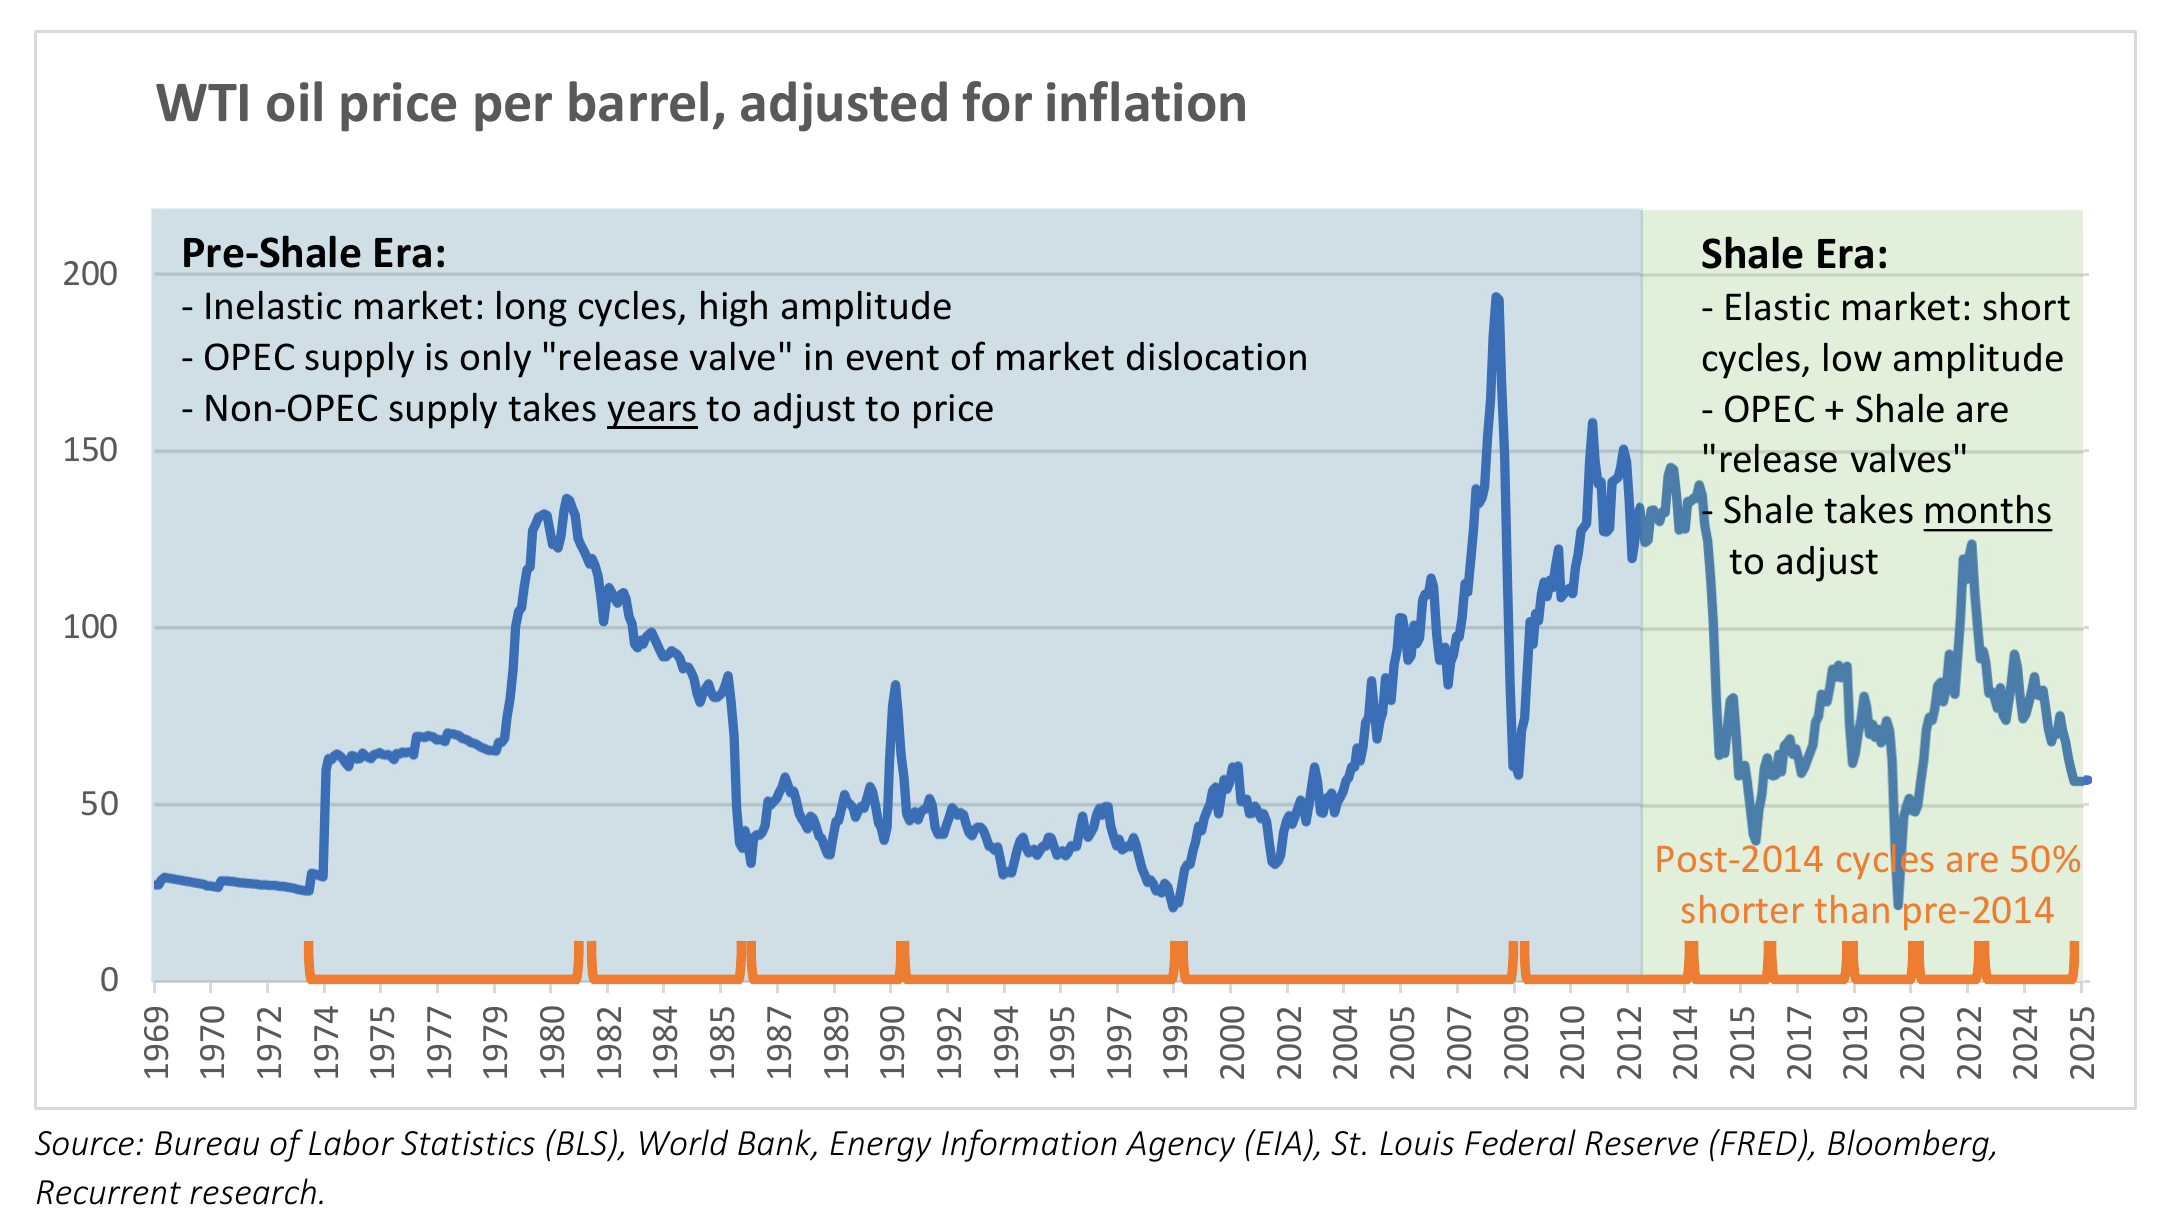
Cycles shortened by about half
Frack-tured Cartel: inflation-adjusted WTI, pre-shale versus shale era
Inflation-adjusted WTI · pre-shale vs. shale era Bloomberg · Recurrent Research · 2025
2025 Framework
Cuts only work until shale answers
<12 mo

Past that window, OPEC cuts stop lifting price. Shale has had time to fill the hole.

After 12 months, shale-era cuts have been associated with weaker prices, not tighter ones.
Cut efficacy after 12 months The Frack-tured Cartel · Recurrent Research · 2025
2025 Scorecard

Headlines got more extreme. Oil prices got less extreme.

COVID, Ukraine and a decade of OPEC interventions made the oil market look more chaotic. But when we went back to the data, extreme prices had actually become much rarer.

From 1973 to 2014, inflation-adjusted WTI spent 78% of months above $85 or below $55. Since 2014: 29%. The 12-month future spent only 16% of the time outside that band.

2025 · The Frack-tured Cartel
2025 Scorecard

Cycles shortened by about half

Pre-shale cycles ran 5–10 years. Shale-era cycles have run 2–3. The 2014 crash, the 2020 collapse and the 2022 spike were violent — and brief.

Shale became a world-scale elastic source: capable of more than 1 million barrels a day of growth or shrinkage inside twelve months, from a North American base now above 10 million barrels a day.

Cartel p.4 · inflation-adjusted WTI
2025 Framework

Cuts only work until shale answers

In an inelastic market, a cut can hold for years. In a shale market, a cut longer than about twelve months invites the barrels you just withheld.

That is the fracture in the cartel: OPEC can still move the front of the curve. It cannot own the back of the curve the way it did from 1973 to 2014.

Cartel framework · cut efficacy after 12 months
2026 · The Ultimate Stress Test

Then history handed us an even harder test.

By 2025, we had concluded that the framework had survived eight extraordinary years. Then came war with Iran and severe disruption to the Strait of Hormuz — the oil-market scenario that virtually every prominent forecaster had treated as the path to a sustained price explosion.

Prompt WTI
The market spiked. It did not stay there.

The physical shock was real, and prompt prices broke above our shale-era range at points. But even through the war, oil spent most of its time inside or near the same inflation-adjusted range that has defined the shale era.

$55–$85 Inflation-adjusted
shale-era range
As we write in August 2026, the framework is still holding.

The important distinction was never whether geopolitics could create an acute shortage or a violent prompt spike. It was whether that shortage could become another long-lived 1970s-style oil cycle. The forward market has continued to say no.

The Iran war did not disprove the dispatch-curve framework. It became its most demanding proof point. Shale cannot prevent shocks. What it changed was the market’s ability to sustain them.

The original research

The framework began with our 2017 work on shale and the oil cycle. In 2025, we returned to the evidence and asked whether eight years of subsequent market history had changed the conclusion.