Recurrent lookback | 2010 / 2018 / 2020 / 2026

Midstream’s Journey Back from “Junk” Recurrent's research diagnosed the debt-driven midstream downturn, and explained how capital restraint and lower growth could drive a powerful recovery.

THE POINT The downturn was not an earnings cycle. It was a balance-sheet recession.

Investors were drawn into midstream on a cash-flow pitch. Four “irrefutable truths”: no commodity exposure, fixed fees, long-term contracts, a toll-road business.

The investment was sold as boring. And through the 2000s, it largely was.

As debt accumulated in the 2010s, investors priced midstream dividends like “junk”-rated debt.

Balance-sheet repair came at the expense of dividend cuts and reduced growth rates.

But since 2020, free-cash-flow inflection and persistent capital discipline have restored balance sheets and underpinned a multi-year recovery in midstream stocks.

The pitch barely referenced the balance sheet. Underneath those stable cash flows, the sector was trying to serve two masters: a near-90% payout and shale-scale capex that could not be funded internally.

Unwilling to choose between generous payouts and capex-heavy growth, midstream chose both, at the cost of the sector’s credit quality.

Master limited partnerships had become master leveraged partnerships.

Then the distribution cuts began. The working theory was still cash-flow-centric: a temporary dip, an oil scare, a company-specific financing problem. The pipes were still there. The contracts were still there. Surely the distributions would recover.

The first visible crack

The balance sheets had reached leverage levels associated with “junk.”
Equity markets began pricing that risk before the ratings agencies did.

Most major pipelines avoided formal downgrades into high yield. But as leverage approached 5.5x and distribution cuts began, the equities stopped behaving like defensive income securities. The debt ratings often remained investment grade; the equity market was already repricing the residual claim for a balance sheet that looked far riskier than the original cash-flow pitch implied.

The variable investors were not watching
By 2016, leverage had reached levels associated with high-yield “junk” credit, even though most issuers avoided formal downgrades.
THE MISSING LINE IN THE PITCH The pitch never referenced the balance sheet.
B-like leverage
BB-like leverage
BBB-like leverage
3.8x
2005
4.5x
2010
5.0x
2014
5.5x
2016
3.8x
2026
Debt / EBITDA: 3.8x → 5.5x → 3.8xEquity risk repriced before most debt ratings did
The first market clue
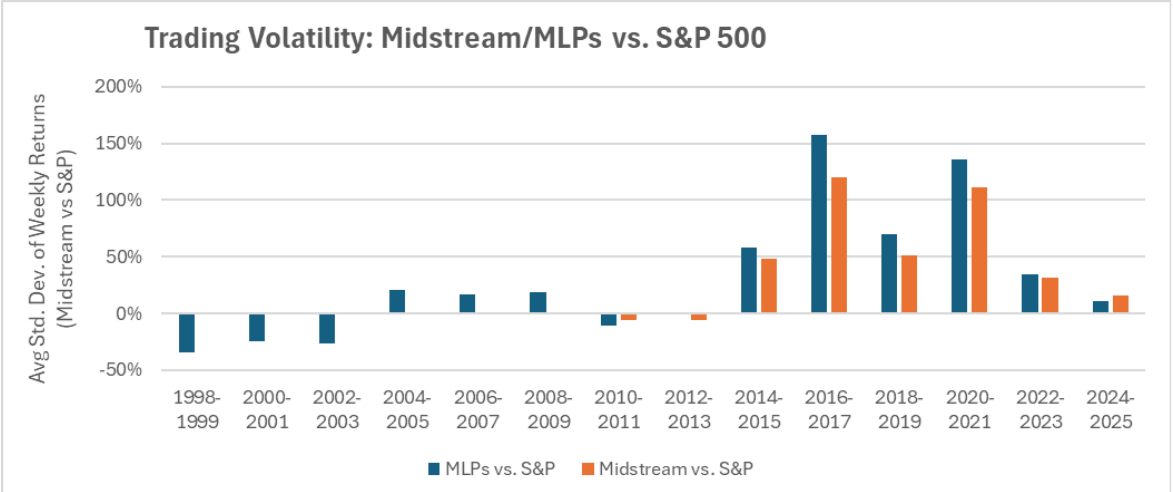
The low-volatility equity of the 1990s and 2000s became a high-volatility investment as leverage breached the old BBB range.
Recurrent chart showing midstream trading volatility versus the S&P 500 across time
The historical evidence for “low-risk equity” disappeared as leverage roseRecurrent monthly commentary | Feb 2025
The denial phase
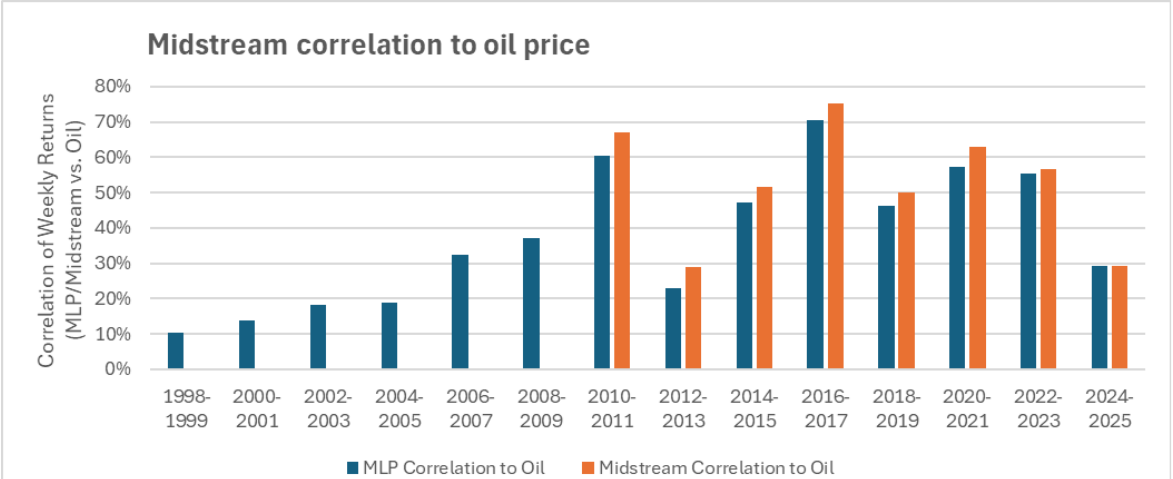
Volatile trading and rising oil correlations were symptoms of a capital structure under stress.
Recurrent chart showing midstream correlation to oil price over time
THE TELL The pipes started trading worse than oil, particularly on the way down.
Oil correlation rose dramatically during the leveraged regimeRecurrent monthly commentary | Feb 2025
Why the recovery took years
The sector could cut new projects, but it could not unwind years of committed capex already in progress.
Peak dividend payout ratio
88%
little retained cash available for debt reduction
Peak annual asset growth
48%
capex already committed and in progress
Peak Debt / EBITDA
5.5x
the balance-sheet burden built over years
Existing project commitments + some dividend support + too much debtRecurrent research
The balance sheet deteriorated before the narrative did

In the mid-2010s, balance-sheet analysis did not make it into the fundraising pitch—with good reason.

The sales pitch focused almost entirely on asset-level safety. What it omitted was the leverage required to fund the buildout. Layering 5.0x+ Debt / EBITDA on top of near-90% payout ratios meant equity holders were no longer simply holding a defensive income vehicle. They were holding the residual claim beneath a rapidly weakening capital structure.

Years of stable operating cash flow made that deterioration easy to miss. The contracts could keep paying while the equity became progressively more levered.

The analytical error was treating stable cash flow as evidence of a low-risk equity.
The market started telling a different story
Focus · Structurally rising volatility

Investments underwritten from the low-volatility experience of the 1990s and 2000s became high-volatility investments by 2014 as balance sheets creaked under heavy debt loads.

How much had increased debt leverage increased the risk profile for midstream equity investors?

As leverage rose, changes in enterprise value were magnified in the residual equity claim. Midstream volatility rose sharply as the sector moved beyond its old BBB-like leverage range, then fell again as leverage later declined.

The operating assets did not need to become commodity businesses for the stocks to start behaving like cyclical, financially stressed equities.

Volatility increases with leverage.
Why investors stayed in denial
Focus · Oil correlation

As leverage rose, midstream increasingly traded with oil. Volatile trading and rising oil correlations were symptoms of a capital structure that had become far more fragile.

Then the pipes started trading worse than oil, particularly on the way down.

Years of strong returns had trained investors to treat midstream drawdowns as temporary dislocations in otherwise dependable income vehicles. Admitting the investment itself had changed was much harder than blaming oil.

But the downside became too violent and too asymmetric to explain as simple commodity beta. Oil was the market’s shorthand for a much more insidious problem: a highly levered equity claim sitting beneath a still-stable set of contracts.

The recovery took longer to begin than equity holders were willing to wait

You cannot stop a half-built pipe.

Operators could cancel future projects, but they still had to finish billions of dollars of multi-year megaprojects already underway. Capex already in progress kept consuming cash. Even after dividend cuts began, companies still needed to maintain some payout while trying to restore credit quality.

The debt had taken years to accumulate. With committed capex still running through the system, the cure was inherently slow: finish projects, cut the next wave of spending, retain more cash, and direct the resulting free cash flow toward debt.

Capex in progress + some dividend + 5.5x leverage = years.
The diagnosis

By 2018, the diagnosis was clear.
Volatile trading and high oil correlations were symptoms. Excess leverage was the cause.

Dividend cuts retained cash. Lower capex stopped the accumulation of new WIP. The recovery depended far more on financial policy than on oil price or macro variables.

The multi-year recovery
With capex ongoing and dividends lower but still significant uses of cash, balance-sheet repair required years.
2015
Dividend cuts begin
Retain cash and stop defending an unsustainable payout model.
2018
Capex rolls over
Fewer new projects replace the WIP already entering service.
2019
FCF tide turns
Financial policy, not oil, becomes the key recovery variable.
2020
COVID capitulation
Costs of capital soar and companies cut even deeper.
The balance-sheet recession took years because the debt and WIP took years to buildRecurrent framework
What we wrote in 2019
The recovery was far more dependent on financial policies than on oil prices or production volumes.
“The recovery is far more dependent on financial policies than oil price or macro variables.”
Lower dividend payouts and structurally lower capex created the free cash flow required to reduce debt.
The Journey Back from “Junk”Recurrent research | 2019
The multi-year recovery

By 2019, lower payouts and structurally lower capex were finally turning the free-cash-flow tide.

Dividend cuts retained cash. Capex was falling. Projects that had absorbed capital for years were finally entering service. Debt reduction was beginning to work through the system.

But the investor base had already been brutalized by years of disappointment. The few investors who remained needed evidence that the recovery would survive another shock.

Then COVID hit

The worst macro shock in decades arrived just as the financial repair was beginning to show up.

COVID crushed energy sentiment, raised costs of capital and effectively closed external financing options. The few remaining investors started to stampede out.

Companies responded by cutting dividends and capex even deeper. From the investor's perspective, it looked like one more disaster. From the balance sheet's perspective, those cuts accelerated the reset.

The same event that completed the capitulation also completed the transition to a self-funded model.
The 2020 inversion

At the bottom of COVID, years of dividend cuts and underperformance met macro panic.
Even pessimistic financial outlooks pointed to sustained free cash flow.

Projects already in progress would keep entering service. Capex would keep falling. Dividend commitments were smaller. Valuations had been crushed by the selloff. The same cuts investors experienced as evidence of failure were creating the conditions for a structural shift to sustained free cash flow generation.

The inflection hiding in plain sight
The free-cash-flow wedge opened as capex collapsed and legacy projects entered service.
Recurrent chart showing midstream cash flow, capex and free cash flow from 2014 through 2028 estimates
CAPEXNew greenfield commitments fall sharply.
PROJECTSLegacy WIP keeps entering commercial service.
PAYOUTSSmaller dividends leave far more cash inside the business.
Primary driver of the FCF inflection: lower capex, not higher commodity pricesRMLPX Q2 2026 | p.10
COVID was the cleanest test
Even in the worst energy downturn in history, midstream free cash flow grew.
2020 EBITDA pressure~$5B

Operating conditions deteriorated sharply.

2020 capex cuts~$7B

Spending fell by even more than EBITDA.

Free cash flow

FCF improved despite the macro shock.

COVID separated the operating cycle from the capital cycleRecurrent estimates | 2020
What the market could not see

The investor base was expecting another disaster. The financial statements were setting up a cash-flow wave.

By the COVID bottom, companies had cut dividends and capex to the bone. But the projects that had consumed billions of dollars over the prior years did not disappear. They kept entering service and producing cash.

That created a powerful mechanical setup: operating cash flow from a larger installed asset base, sharply lower new capex, and much smaller dividend commitments. The difference had to show up as free cash flow.

The recovery did not require a heroic demand forecast. It was already visible in the cash-flow bridge.
The proof arrived immediately

COVID provided a dramatic stress test: even in the worst energy downturn in history, midstream free cash flow grew.

In 2020, our estimates showed roughly $5 billion of EBITDA pressure but about $7 billion of capex cuts. Free cash flow improved even while the operating environment deteriorated.

That was the point of maximum disconnect. Valuations reflected a permanently impaired business, while the financial model was becoming structurally more cash generative.

~$5B EBITDA pressure − ~$7B capex cuts = higher free cash flow.
The longer historical record

The longer record bore out what we had been predicting since before COVID.
Midstream performed best when growth was slow and capital efficiency was high.

High growth required external financing and converted much of the balance sheet into “fallow capital”: capex in progress, tied up in zero-return construction instead of operating assets generating cash flow.

The full historical record
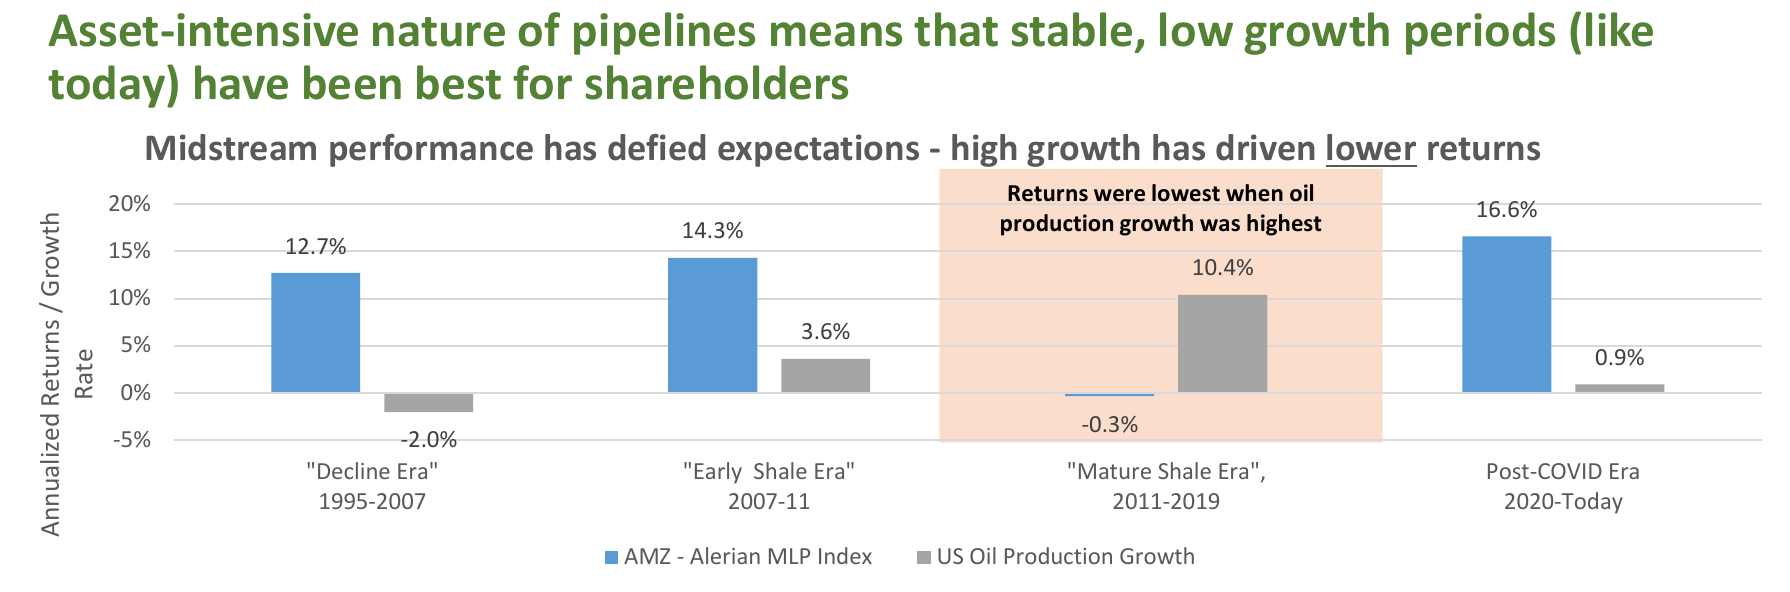
High production growth did not produce high midstream returns.
Recurrent chart comparing Alerian MLP Index returns with US oil production growth across four eras
The old intuition More production more throughput more tolls better returns.
The historical record gave almost the opposite answerRMLPX Q2 2026 | p.7
01 | Decline era
Production fell. Midstream investors still compounded at double digits.
1995 to 2007 decline era highlighted
−2.0% production growth · +12.7% AMZ returnBloomberg · Recurrent research
02 | Early shale
Moderate growth still left room for attractive shareholder returns.
2007 to 2011 early shale era highlighted
+3.6% production growth · +14.3% AMZ returnBloomberg · Recurrent research
03 | Mature shale
The highest volume growth coincided with the worst shareholder returns.
2011 to 2019 mature shale era highlighted
+10.4% production growth · −0.3% AMZ returnBloomberg · Recurrent research
04 | Post-COVID
Growth slowed again. Returns surged again.
2020 to today post-COVID era highlighted
+0.9% production growth · +16.6% AMZ returnBloomberg · Recurrent research
Why the relationship reversed
High growth converted more of the balance sheet into capex in progress before those assets could generate cash.
Recurrent chart explaining fallow capital and returns on invested capital
“Fallow capital” = capex in progress, tied up in zero-return constructionThe Virtues of Slower Growth | 2020
The result that reverses the old growth intuition

Midstream has historically performed best when production growth was low or negative, and worst when growth was highest.

That sounds counterintuitive only if the analysis stops at throughput. For long-cycle infrastructure, serving extreme growth requires years of capital commitments before the new assets produce cash.

The question is not simply how fast volumes grow. It is how much incremental invested capital is required to serve that growth, and how long that capital sits fallow before earning a return.

1995–2007 | Decline era
Production−2.0%AMZ return+12.7%

Low or negative growth was compatible with strong equity returns because capital requirements were low and cash flow generation was steady.

The installed asset base generated steady cash while the sector had relatively little need for externally financed expansion capex.

2007–2011 | Early shale
Production+3.6%AMZ return+14.3%

Moderate growth was not the problem.

The early shale period shows that growth itself was not poisonous. The problem emerged when the entire financing model had to be reorganized around funding extraordinary growth.

2011–2019 | Mature shale
Production+10.4%AMZ return−0.3%

The shale boom delivered exactly the volume growth investors thought they wanted, and the worst returns of the four regimes.

An asset-heavy business was forced into a high-growth, external-funding model. New pipes consumed capital years before they produced cash. High payouts left little internally generated capital. Debt and equity filled the gap.

2020–Today | Post-COVID
Production+0.9%AMZ return+16.6%

The sector recovered without recreating the shale growth boom.

With growth subdued, capex remained restrained. The installed asset base generated cash, leverage fell, and increasingly the capital budget shifted from multibillion-dollar megaprojects toward high-value, low-dollar optimization projects.

The mechanism

High growth converted operating balance sheets into capex in progress.

During the shale buildout, nearly 45% of sector capital was tied up in non-earning construction assets. This was “fallow capital”: capex in progress, sitting in zero-return construction instead of operating assets generating cash flow.

The invested-capital denominator expanded immediately while cash flow could arrive three to six years later. Once fewer megaprojects replaced the assets entering service, fallow capital fell and capital efficiency improved rapidly.

The post-COVID recovery has been a capital-efficiency cycle, not another volume-growth cycle.
Why the old machine has stayed off

Management did not suddenly become virtuous.
The market stopped paying companies to build more steel.

Valuations remain well below the levels that historically encouraged aggressive capital formation. Regulatory risk further reduces the appetite for long-cycle greenfield projects. Management incentives reinforce the change, but valuation is the primary brake.

The primary capex variable
Capital growth has tracked valuation far more closely than prior profitability.
Recurrent chart comparing energy infrastructure valuation with capital spending and profitability
EV / IC vs. capital growth: R² ≈ 0.706Recurrent monthly commentary | Jan 2026
Why discipline persists
Valuation sets the incentive. Regulation and management incentives reinforce it.
01 · PRIMARY
Valuation

Without a premium EV/IC multiple, the market does not reward management for creating more invested capital.

02 · SECONDARY
Regulatory friction

Permitting risk raises the hurdle rate for long-cycle greenfield WIP.

03 · REINFORCING
Capital efficiency

Smaller optimization projects can generate attractive returns without recreating shale-era balance-sheet risk.

Low valuation + high project friction = restrained capexRecurrent capital-cycle framework
The framework beyond midstream

Valuation multiples, not profitability or management sentiment, drive the capex cycle.

Across decades of energy infrastructure data, capital spending tracks valuation (EV/IC) with an R² of 0.706, while prior profitability (ROIC) explains just 4% of capex variation (R² = 0.044).

When the market pays a high multiple for invested capital, management is incentivized to build. Without elevated valuations, capex stays low.

Valuation / capital growth R² ≈ 0.706. Profitability / capital growth R² ≈ 0.044.
What replaced the megaproject model

The sector can still invest without rebuilding the balance-sheet risk that broke it.

Regulatory risk further reduces appetite for large greenfield projects, while management teams have increasingly favored self-funding and capital efficiency. But the biggest change is economic: the market does not offer a premium valuation for raw asset growth.

That has pushed the opportunity set toward smaller, high-value optimization projects that require far less capital and can earn returns much faster than the shale-era megaprojects.

The capital budget did not disappear. Its scale, duration and return threshold changed.

The financing model finally stopped fighting the assets.

The recovery was powered by sustained debt reduction, restrained capital expenditures, and massive free cash flow from a sector whose market capitalization had been severely compressed by the COVID selloff.

~25%annual returns from the COVID bottom, based on the period referenced in this lookback
Double-digitcash-flow yields powering the early recovery
3.8xDebt / EBITDA back near the pre-shale range

Capital efficiency improved dramatically as megaprojects gave way to high-value, lower-dollar optimization projects. The installed asset base kept generating cash while the balance sheet required progressively less capital to support it.

Cash-flow analysis of long-cycle infrastructure is incomplete without the balance sheet and capital cycle. The balance-sheet recession began years before investors recognized it. The recovery did too.

Request Institutional Research & Capital Cycle Models
Access our firm's proprietary EV/IC valuations, leverage transition datasets, and quarterly energy infrastructure commentary.
Contact Investment Team →